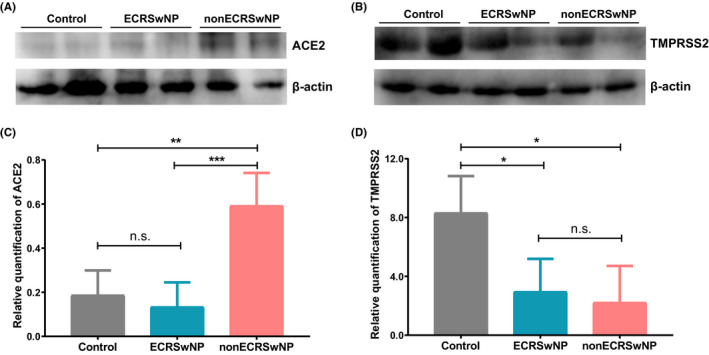
Figure 2.

Expression of (A) ACE2 and (B) TMPRSS2 detected by Western blot assay in nasal tissues of control subjects, ECRSwNP patients and nonECRSwNP patients. C,D, The intensity of protein bands was quantified by densitometry and normalized to β‐actin. Data are presented as means ± SDs (n = 4 for each group). *P < .05, **P < .01, ***P < .001, Kruskal‐Wallis ANOVA with post hoc Dunn's multiple comparisons test. CRSwNP, chronic rhinosinusitis with nasal polyps; ECRSwNP, eosinophilic CRSwNP; nonECRSwNP, noneosinophilic CRSwNP; ACE2, angiotensin‐converting enzyme 2; TMPRSS2, transmembrane protease serine 2; n.s., no significance
