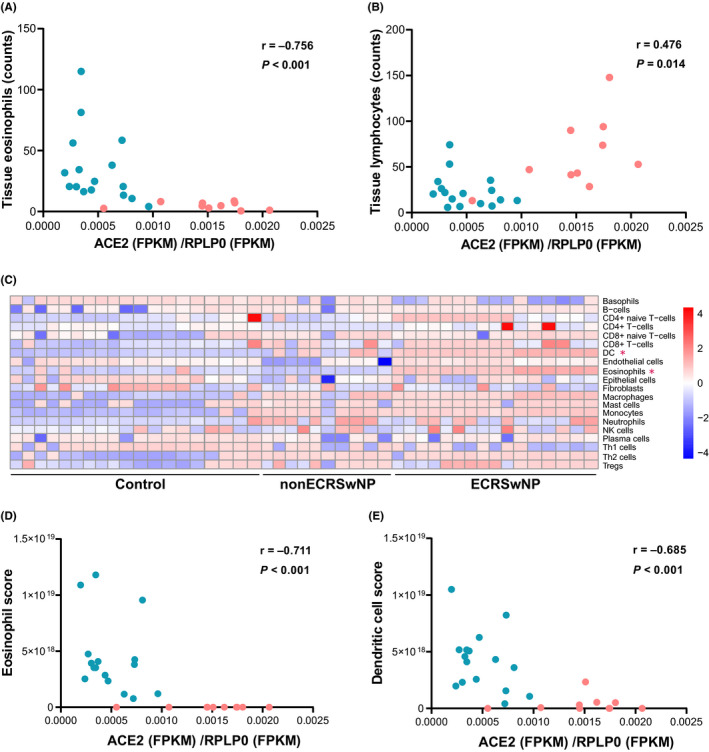
Figure 3.

Association between ACE2 expression and differentially infiltrating immune cells in nasal tissue of ECRSwNP and nonECRSwNP patients. A,B, Correlations between ACE2 expression and tissue eosinophils and lymphocytes. ECRSwNP patients are depicted by turquoise dots and nonECRSwNP patients by red dots. C, Cell type deconvolution analysis on gene expression in ECRSwNP and nonECRSwNP patients and control subjects, using xCell. Heatmap depicts the cell type enrichment scores (xCell scores) calculated based on the gene expression data in each sample. *Significantly different between ECRSwNP and nonECRSwNP. D,E, Association between ACE2 expression and xCell scores for eosinophils and dendritic cells, assessed by Spearman correlation analysis. N = 19 for control subjects, n = 16 for ECRSwNP patients and n = 10 for nonECRSwNP patients. CRSwNP, chronic rhinosinusitis with nasal polyps; ECRSwNP, eosinophilic CRSwNP; nonECRSwNP, noneosinophilic CRSwNP; ACE2, angiotensin‐converting enzyme 2; RPLP0, ribosomal protein lateral stalk subunit P0; FPKM, fragments per kilo‐base of exon per million fragments mapped; DC, dendritic cells
