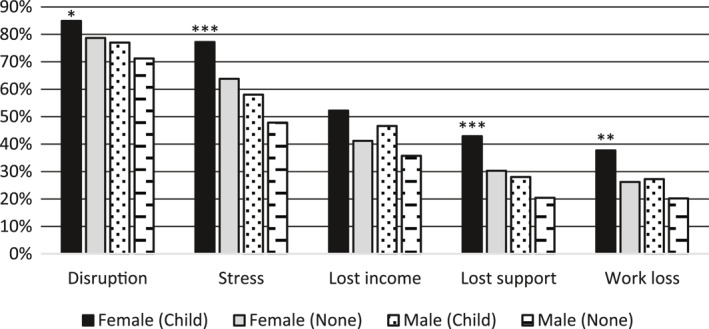
FIGURE 1.

Coronavirus effects by gender & parental status. These results are a test of H4. Equality of proportions statistical tests were performed to compare the female with children category against the next highest category for each impact type (e.g., disruption). The result appears above the “Female (Child)” bar for each impact. ***p ≤ 0.001, **p ≤ 0.01, *p ≤ 0.05
