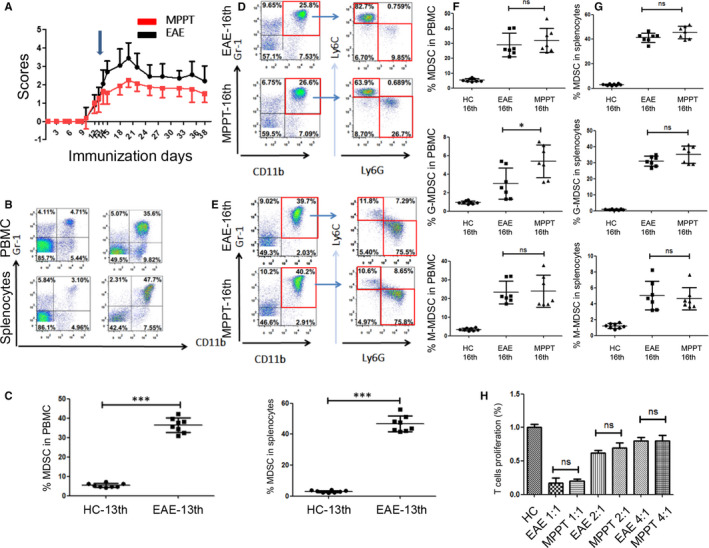
FIGURE 1.

The expansion of MDSC is independent of GC treatment in EAE. A, EAE models were successfully established. Methylprednisolone (100 mg/kg) was administered after EAE induction on the 13th day (blue arrow, average clinical score = 1). The dose was halved every 3 d gradually (100 mg/kg for 3 d, 50 mg/kg for 3 d, 25 mg/kg for 3 d). The injection was stopped on the 10th day after the initial injection. EAE development in mice (each group n = 10) was followed, and clinical scores were recorded (P < 0.001, MPPT vs EAE). B, Representative staining profiles of MDSC from PBMC from the healthy control (HC) and EAE groups. The cells were collected on the 13th day. C, Percentages of MDSC from PBMC (P < 0.0001) and whole splenocyte population (P < 0.0001) of the EAE and MPPT groups. The cells were collected on the 13th day. D‐E, Representative staining profiles of MDSC, M‐MDSC, and G‐MDSC from whole splenocyte populations from the EAE and MPPT groups. The cells were collected on the 16th day. F, Percentages of MDSC (P = 0.4973), G‐MDSC (P = 0.0231, t test), M‐MDSC (P=0.8649) from PBMC of the EAE and MPPT groups. The cells were collected on the 16th day. G, Percentages of MDSC (P = 0.0947), G‐MDSC (P=0.1037), M‐MDSC (P = 0.6652) from the whole splenocyte population of the EAE and MPPT groups. The cells were collected on the 16th day. H, Suppressive function of MDSC and their subsets from splenocytes were evaluated between the EAE and MPPT groups on the 16th day. *P < 0.05; ***P < 0.001
