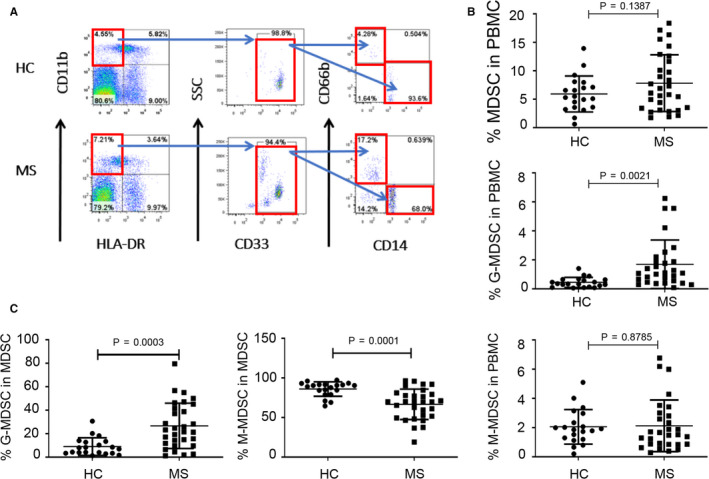
FIGURE 2.

The percentages of G‐MDSC in PBMC from relapsing MS patients were significantly higher than those from HCs. A, Staining profiles of MDSC (CD11b+CD33+HLA‐DR−), M‐MDSC (CD11b+CD33+HLA‐DR−CD14+CD66b−), and G‐MDSC (CD11b+CD33+HLA‐DR−CD14−CD66b+) from a representative HC and a representative MS patient. B, Percentages of MDSC (P = 0.1387), G‐MDSC (P = 0.0021), and M‐MDSC (P = 0.8785) in PBMC of HCs (n = 20) and MS patients (n = 30). C, Percentages of G‐MDSC (P = 0.0003), and M‐MDSC (P = 0.0001) in MDSC of PBMC from HCs (n = 20) and MS patients (n = 30)
