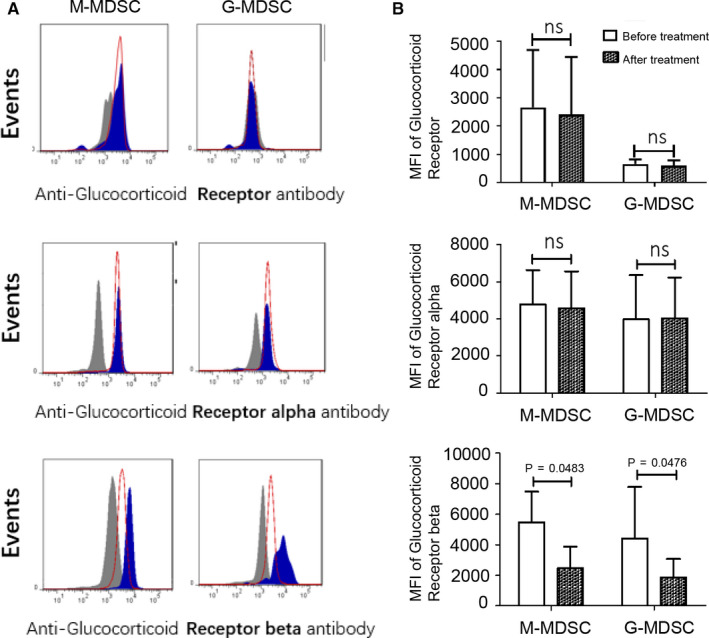
FIGURE 6.

Glucocorticoid receptor expression in two MDSC subsets of relapsing MS patients before and after treatment. A, B, Glucocorticoid receptors (glucocorticoid total receptor, glucocorticoid receptor alpha and glucocorticoid receptor beta) expression in M‐MDSC (n = 4 per group; glucocorticoid total receptor P > 0.05; glucocorticoid receptor alpha P > 0.05; glucocorticoid receptor beta P = 0.0483) and G‐MDSC (n = 4 per group; glucocorticoid total receptor P > 0.05; glucocorticoid receptor alpha P > 0.05; glucocorticoid receptor beta P = 0.0476) from MS patients before MPPT and MS patients after treatment. Fig A shows staining profiles of cells from a representative MS patient before treatment (blue filled) and a representative MS patient after treatment (red line); grey filled: isotype control. Fig B shows representative results of four independent experiments
