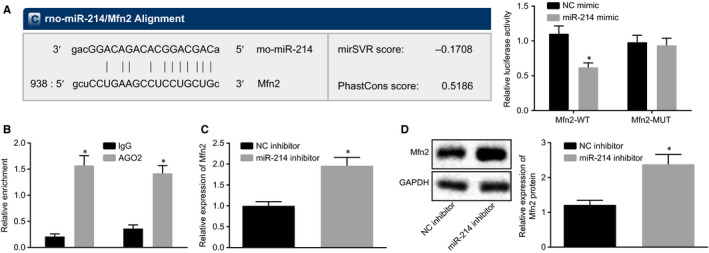
Figure 3.

miR‐214 negatively modulates Mfn2 expression. A, The targeting relationship between miR‐214 and Mfn2 predicted by dual luciferase reporter gene assay. *P < .05 vs NC mimic. B, The binding sites between miR‐214 and Mfn2 verified by RIP. *P < .05 vs IgG. C, The expression of Mfn2 determined by RT‐qPCR. *P < .05 vs NC inhibitor. D, The protein expression of Mfn2 normalized to GAPDH determined by Western blot analysis. *P < .05 vs NC inhibitor. The data were measurement data and expressed as mean ± standard deviation. The data between two groups obeying normal distribution and homogeneous variance in unpaired design were compared using unpaired t test. The cell experiment was repeated three times independently
