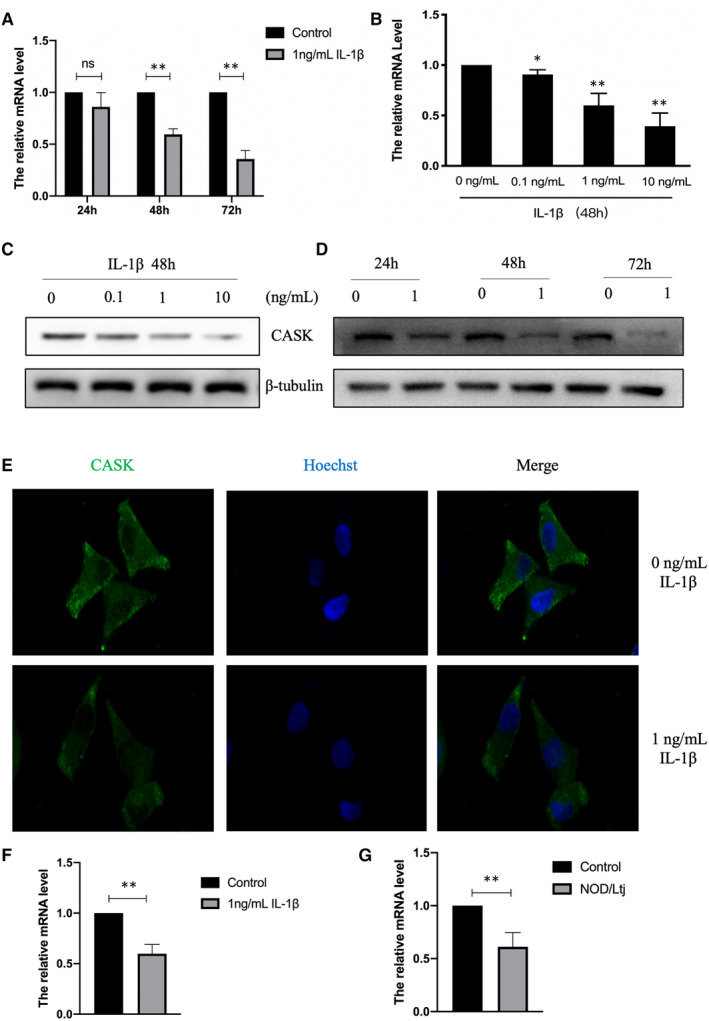
FIGURE 2.

IL‐1β treatment suppresses Cask expression activity in INS‐1 cells and rat islets. The expression of Cask was analysed by qPCR from INS‐1 cells treated with 1 ng/mL IL‐1β for different times (24, 48 or 72 h) (A) or with various concentrations (0, 0.1, 1, and 10 ng/mL) of IL‐1β for 48 h (B). (C and D) The protein levels of CASK were analysed by Western blot. β‐Tubulin was used as the internal control. (E) The location of CASK was analysed by immunofluorescence assay. The images were recorded at a magnification of ×400. (F) The expression of Cask was analysed by qPCR from rat islets treated with 1 ng/mL IL‐1β for 48 h. (G) The expression level of Cask was analysed by qPCR islets from NOD/LtJ and control mice without diabetes. Data are presented as the mean ± SEM (n = 3) of three independent experiments. *P < .05, **P < .01 vs control
