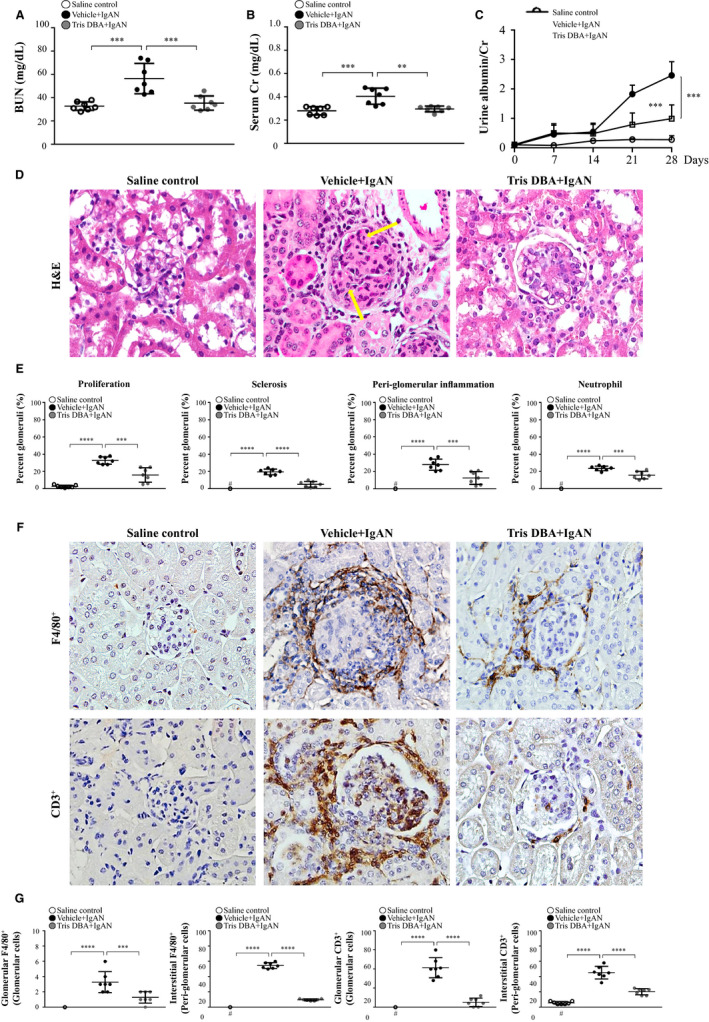
Figure 1.

Renal function, renal pathology and T cells and macrophages infiltration. Levels in the serum (A) BUN and (B) Cr; (C) Albuminuria. D, H&E staining. E, Renal lesion scores. F, CD3+ T cells and F4/80+ macrophages; G, Scoring of CD3+ T cells and F4/80+ macrophages in IHC staining; Original magnification, 400×. Arrow indicates neutrophils. The data are expressed as the mean ± SEM results in 7 mice per group. #Not detectable, **P < .01, ***P < .005, ****P < .001
