Figure 7.

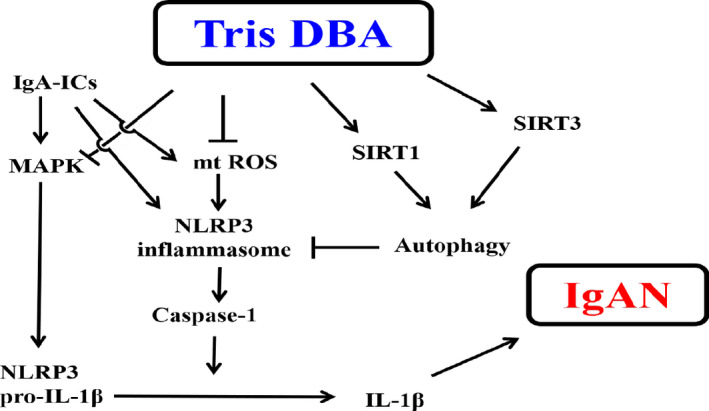
Schematic representation for the plausible mechanism of action of therapeutic effects rendered by Tris DBA. IgA‐ICs, IgA immune complexes; ROS, reactive oxygen species; SIRT1, sirtuin 1; SIRT3, sirtuin 3, mtROS, mitochondrial ROS

Schematic representation for the plausible mechanism of action of therapeutic effects rendered by Tris DBA. IgA‐ICs, IgA immune complexes; ROS, reactive oxygen species; SIRT1, sirtuin 1; SIRT3, sirtuin 3, mtROS, mitochondrial ROS