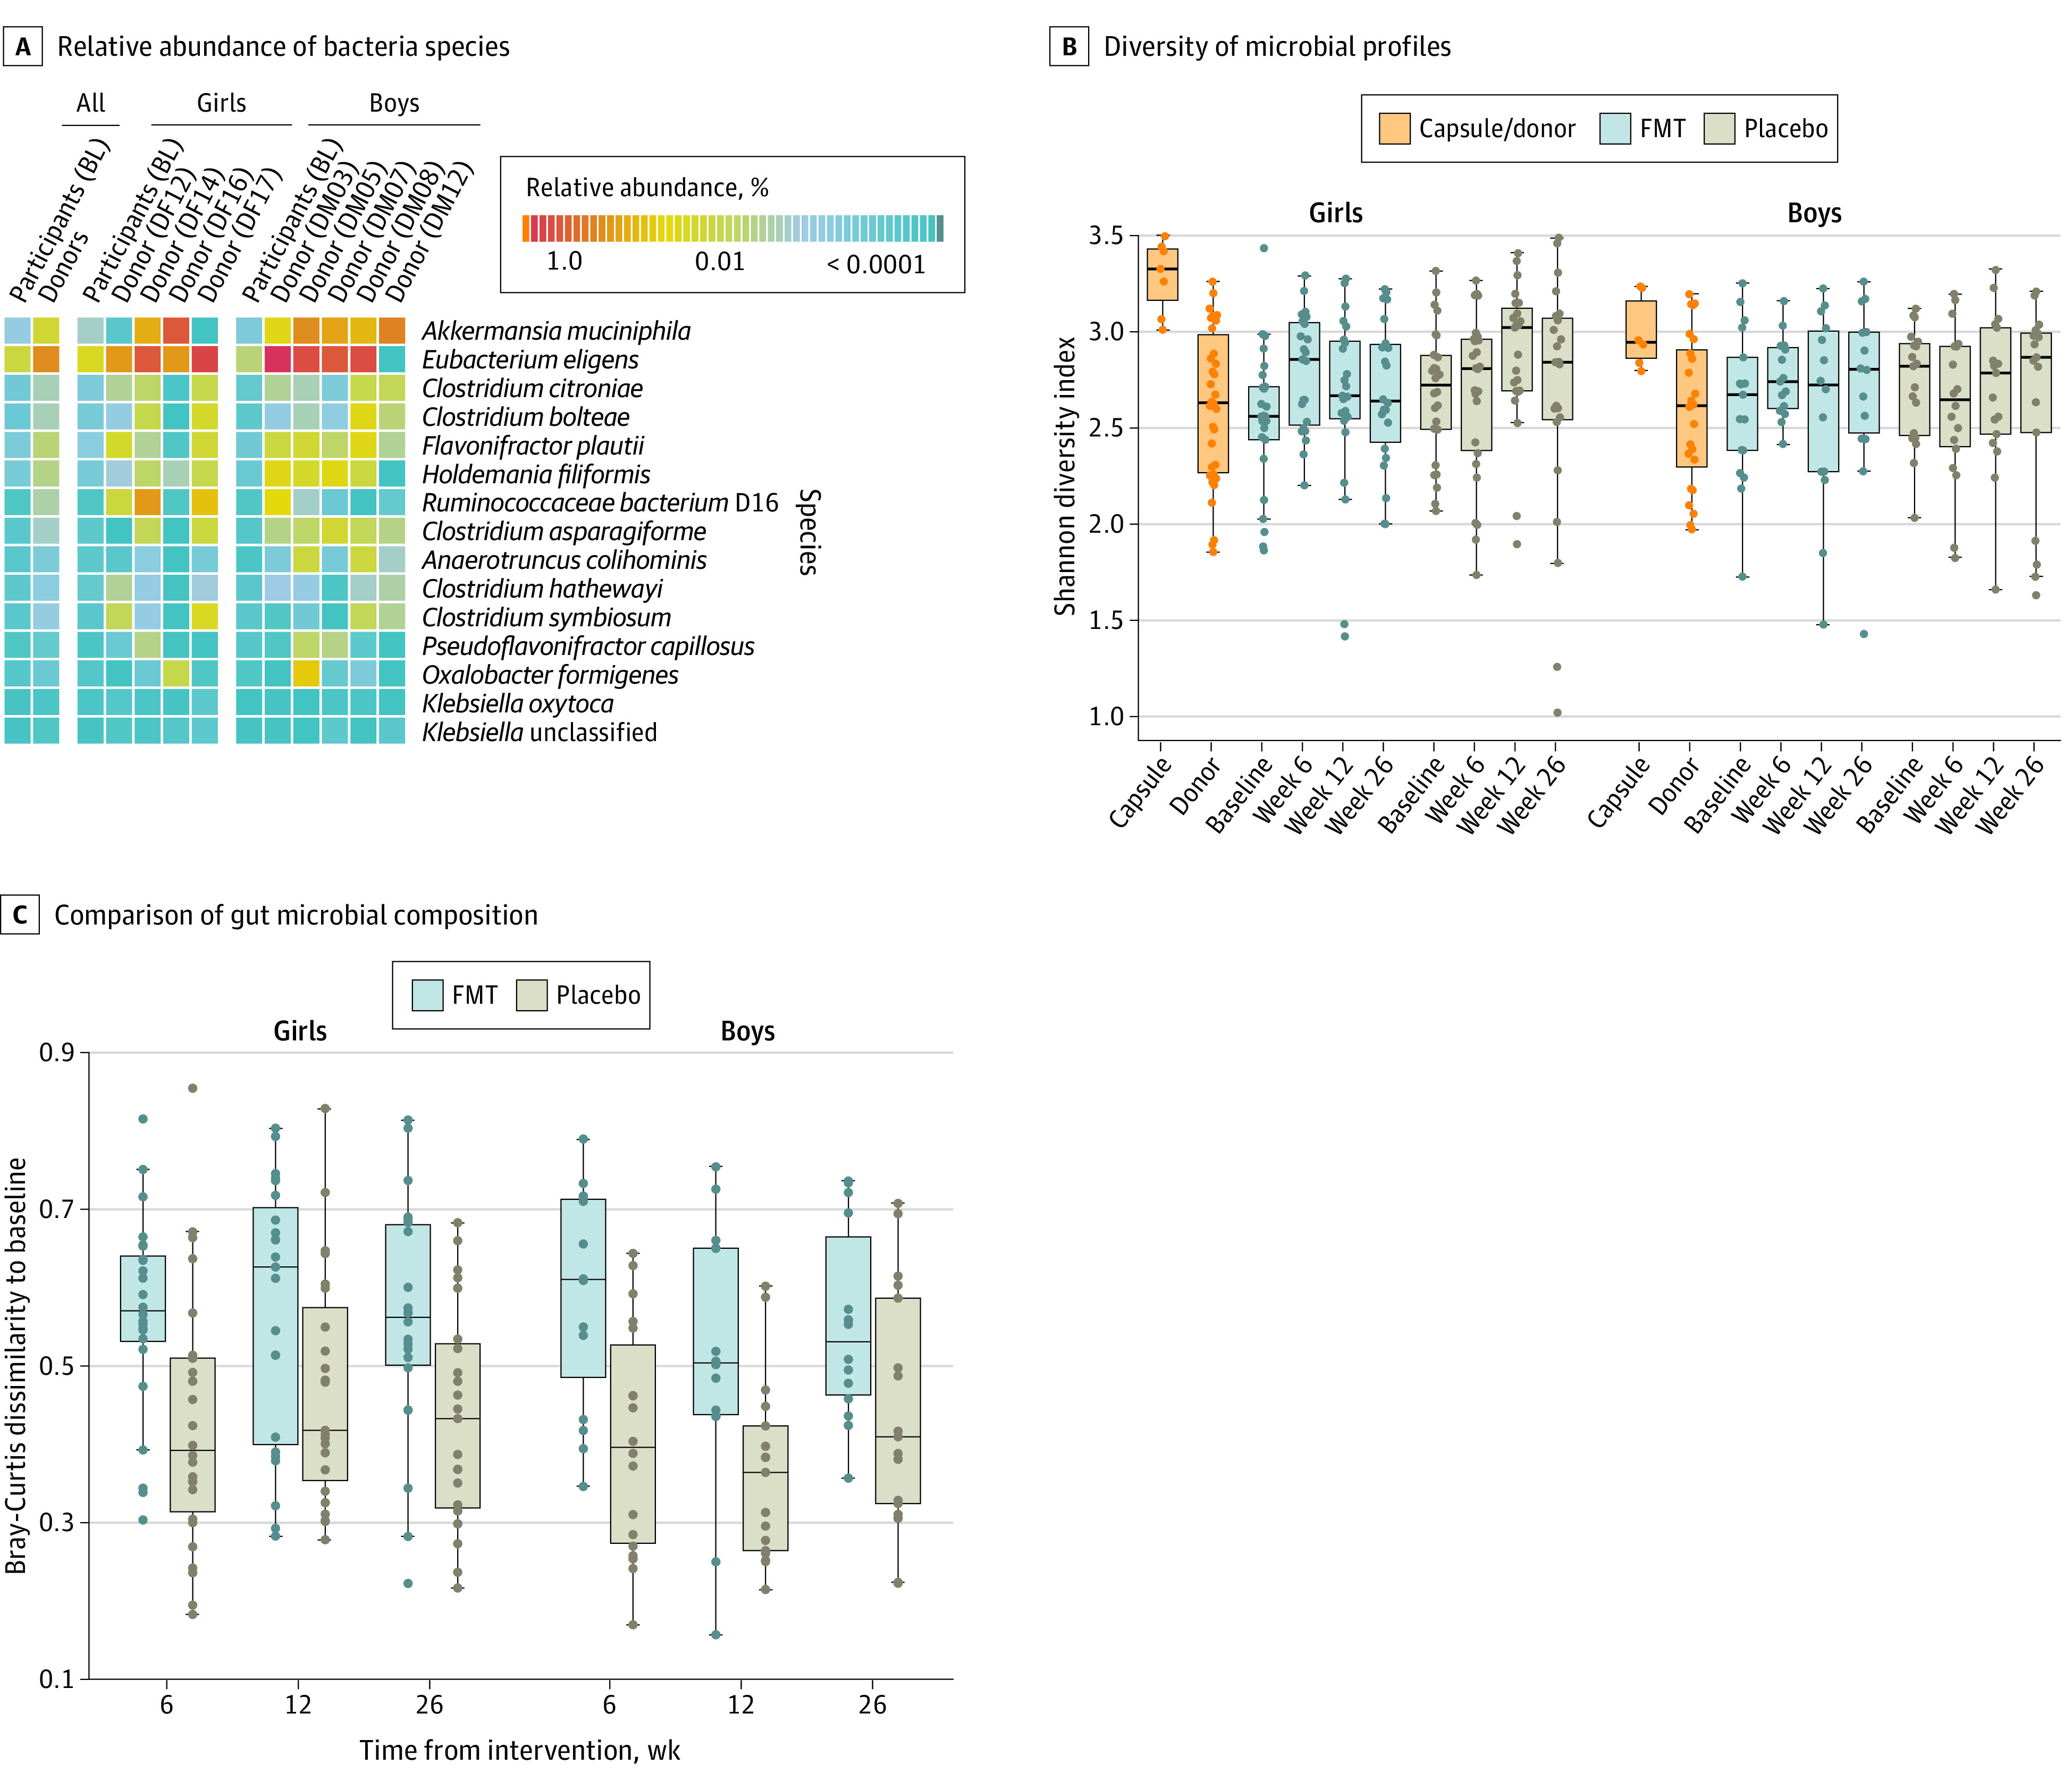
Figure 2. Gut Microbiome Assessment of Donors and Participants.

Boxes indicate interquartile ranges (IQR), and whiskers the range of the data (expanding up to 1.5 × IQR). Each dot indicates an individual’s fecal microbiome sample, except for capsule dots, which are the combination of all 4 contributing donor microbiome samples per batch. FMT indicates fecal microbiome transfer.
