
Figure 7:
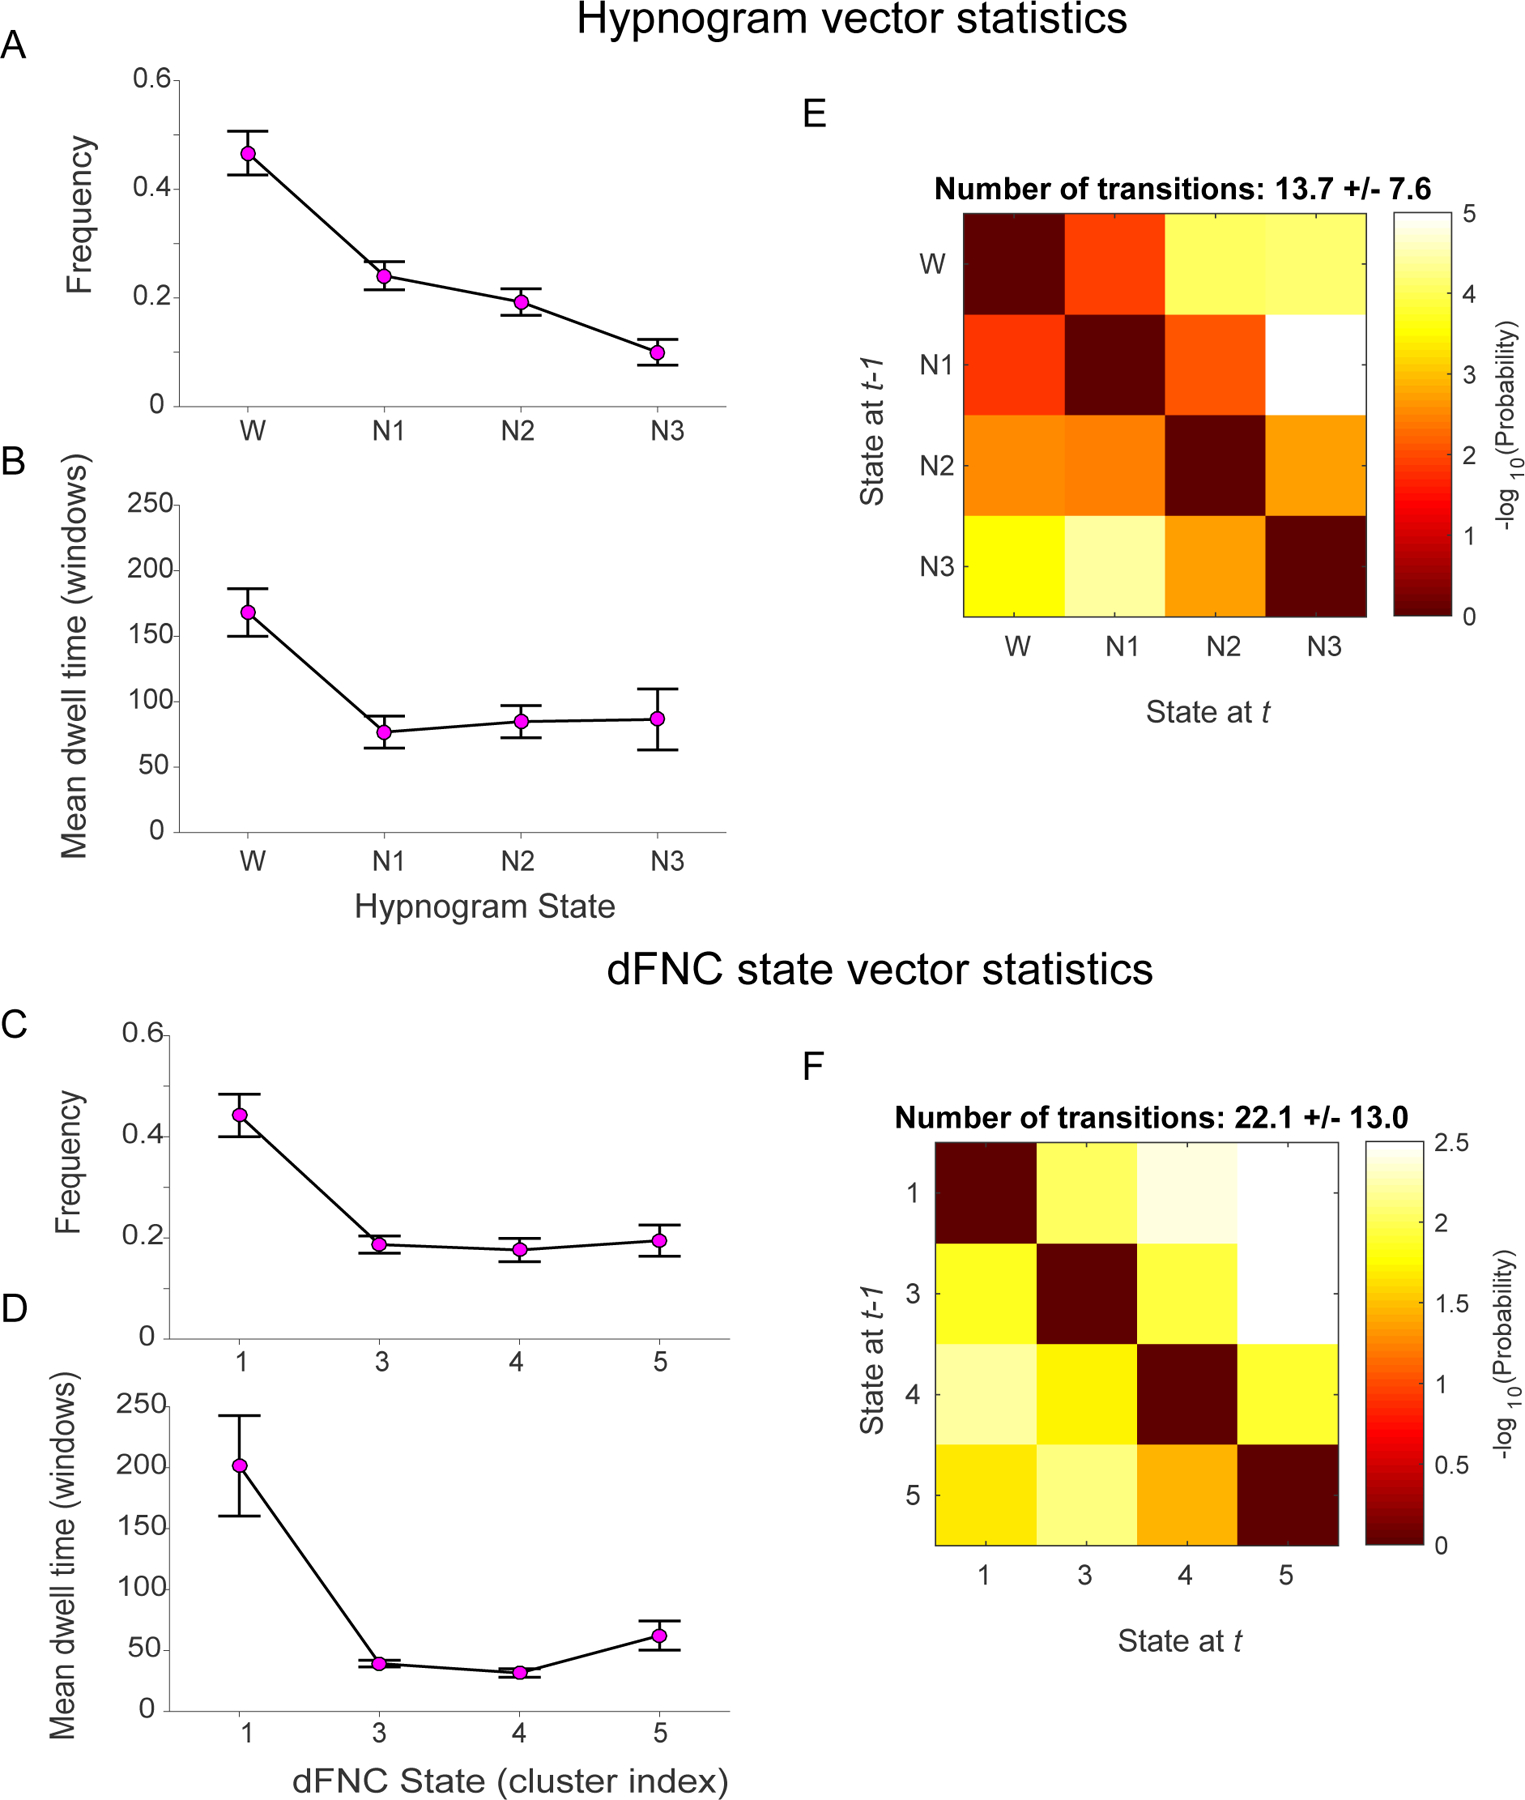
Comparison of state vector statistics and transition matrices computed from EEG-derived hypnograms and dFNC cluster derived subject state vectors. Hypnogram and dFNC state vector exhibit similar frequency of occurrences (A and C) and mean dwell times (C and D) respectively. The mean state transition matrices for hypnogram vectors (E) and dFNC state vectors (F) inform about the probability of transitioning from a given state i at time t-1 to state j at time t. The probabilities are converted to -log(10) scale, so higher (yellow to white) intensity values mean lower probability to transition. For both modalities, these matrices demonstrate tendency to remain in a given state (diagonal values are lower). The transitions to neighboring states are more likely in both the hypnogram and the dFNC state vectors. While there is chance of transitioning from deep sleep N3 to any other state (W, N1 or N2), the probability of transitioning from wakefulness at time t-1 immediately to deeper sleep stages (N2, N3) at time t is very low suggesting gradual transition from W to N3 stage. Note that dFNC states 1 and 2 are combined for this analysis.