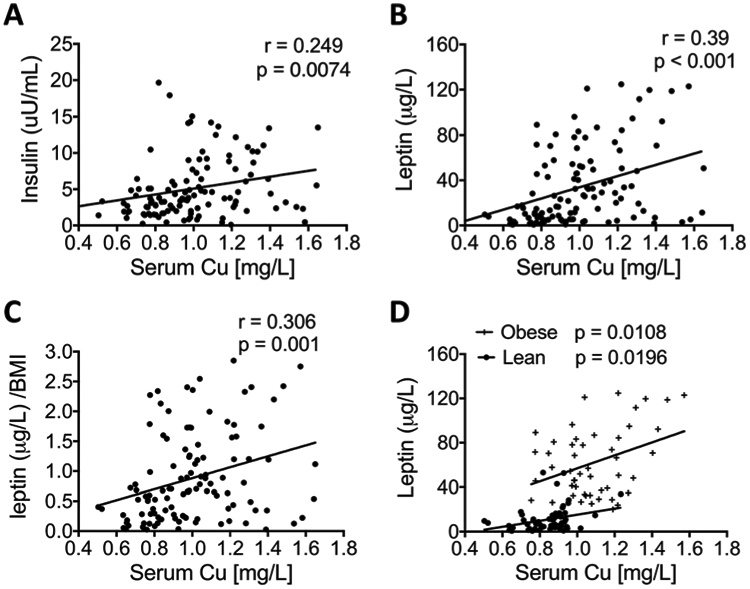
Fig. 2.

Correlations between serum Cu content and serum metabolic parameters. The serum concentrations of (A) leptin, (B) insulin, and (C) leptin/BMI levels in a group combining all obese and lean subjects are plotted against their Cu levels. (D) Leptin levels in either obese patients or lean controls (Ctrl) are plotted against their Cu levels. (Pearson’s r and p values were calculated by using a linear regression analysis.)
