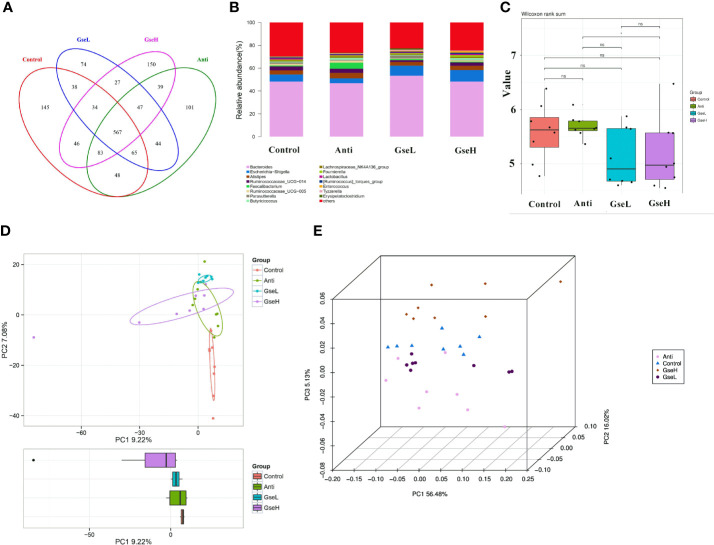
Figure 5.
Summary of the microbial community in the cecal contents of broilers on d 21 (A). is a Venn diagram summarizing the numbers of common and unique observed taxonomic units (OTUs) in the microflora (B). is the top 15 relative abundances of bacterial strains (at the genus level) between groups (C). is the Shannon Index reflecting species diversity within and between groups (D). is the PCA plot (E). is the PCoA analysis. N = 8 per treatment group.

