
Figure 1.
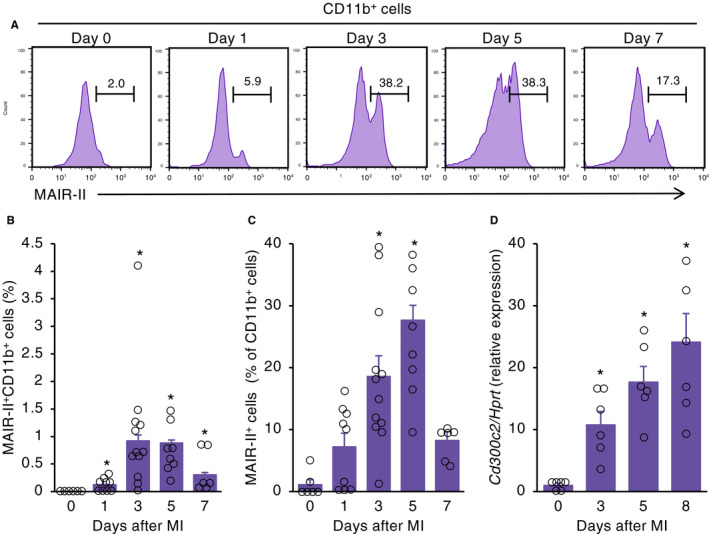
MAIR‐II+ myeloid cells infiltrate into infarcted myocardium. A, Flow‐cytometric analysis of infiltrating MAIR‐II+CD11b+ myeloid cells in WT hearts on days 0, 1, 3, 5 and 7 after MI. B, C, Quantification of flow cytometry of (B) MAIR‐II+CD11b+ cells and (C) MAIR‐II+ cells among CD11b+ cells in infarcted hearts on days 0, 1, 3, 5 and 7 after MI (n = 6‐12 at each time‐point). Results are presented as mean ± SEM. *P < .05 vs day 0 by Steel's method. D, mRNA expression of MAIR‐II (Cd300c2) in hearts obtained from MI mice at the indicated time‐points. Results are reported as the fold change in gene expression relative to baseline expression (n = 6‐7 at each time‐point). The values are expressed as mean ± SEM. *P < .05 by Kruskal‐Wallis analysis with a post hoc Steel test