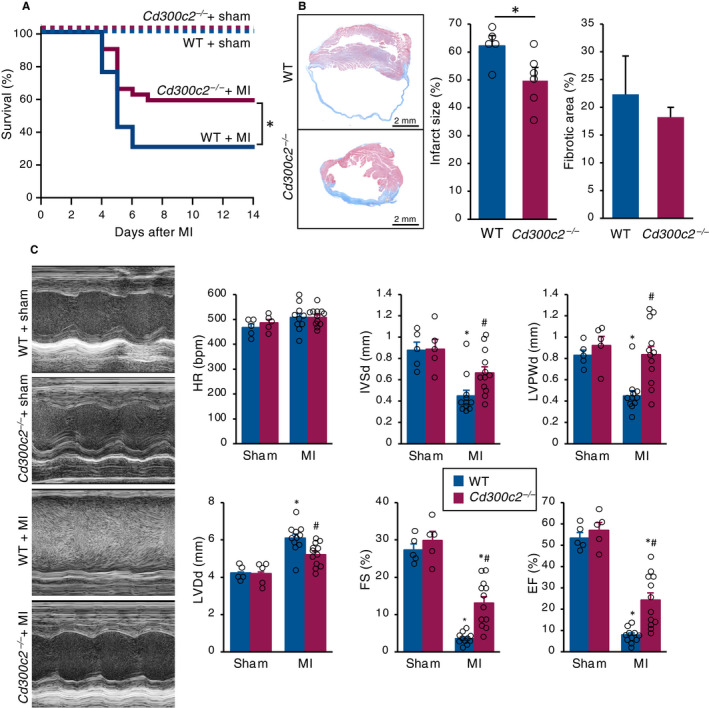
Figure 2.

MAIR‐II deletion attenuates adverse remodelling after MI. A, The Kaplan‐Meier survival analysis 14 days after MI or sham operation. Blue line for WT with MI (n = 33), red line for Cd300c2 −/− with MI (n = 29), dotted blue line for WT with sham operation (n = 5) and dotted red line for KO with sham operation (n = 5). *P < .05 by log‐rank. B, Representative cross sections of heart tissue one month after MI and the quantification of infarct sizes and fibrotic areas between WT and Cd300c2 −/−. Results are presented as mean ± SEM, n = 5‐6 each, *P < .05 by the Mann‐Whitney U test. C, Representative M mode images of echocardiography between sham and post‐MI day 8 in WT and Cd300c2 −/− mice. Bar graphs represent echocardiographic parameters from the indicated animals. Results are presented as mean ± SEM, n = 5‐11, *P < .05 vs sham, #P < .05 vs WT by the Kruskal‐Wallis analysis with a post hoc Steel‐Dwass test
