Figure 5.

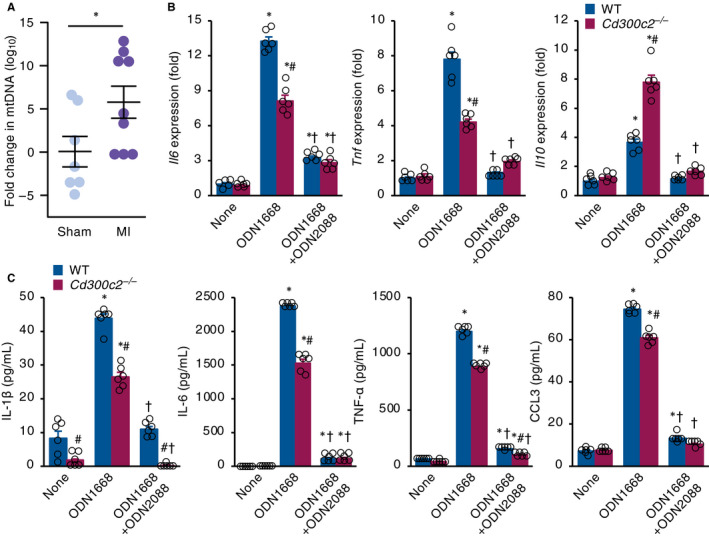
MAIR‐II up‐regulates CpG‐ODN‐TLR9–mediated macrophage activation. A, The plasma levels of circulating mtDNA were measured 1 day after MI or sham operation. Results are reported as the fold change in mtDNA amount relative to sham. The values are expressed as mean ± SEM, n = 7‐9, *P < .05 by an unpaired two‐tailed t test. B, C, Quantification of pro‐inflammatory and anti‐inflammatory cytokine expressions by (B) qRT‐PCR and (C) ELISA in WT and Cd300c2 −/− BMDMs with none, ODN1668 and ODN1668 + ODN2088 stimulation. Results are presented as mean ± SEM, n = 6, * P < .05 vs none, # P < .05 vs WT, † P < .05 vs ODN1668 by one‐way ANOVA with Tukey's post hoc test
