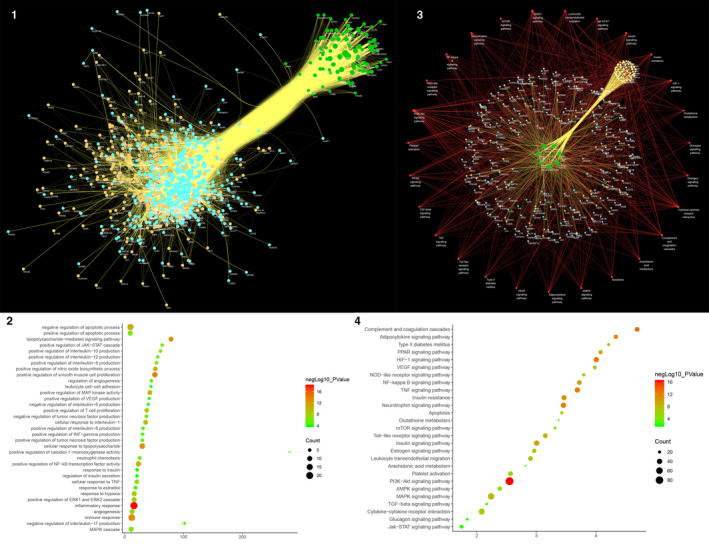
Figure 2.

Results of DSYM‐AS PPI Network A, DSYM‐AS PPI Network (Blue, orange, green circles stand for AS genes, DSYM targets, and DSYM‐AS targets. The larger the node size, the higher the degree of the node. The thicker the line, the greater the Edge Betweenness of the node.). B, Bubble chart of biological processes (X‐axis is fold enrichment analysis). C, Pathway of DSYM‐AS PPI Network (Green circle stands for Herb. Red circle stands for signalling pathways. Blue circle stands for genes. Orange circle stands for DSYM targets. Yellow circle stands for DSYM‐AS targets. Red links stand for relationship among pathways and targets; yellow links stand for relationship among herbs and targets. The larger the node size, the higher the degree of the node. The thicker the line, the greater the Edge Betweenness of the node.). D, Bubble Chart of Signalling Pathway (X‐axis is fold enrichment analysis)
