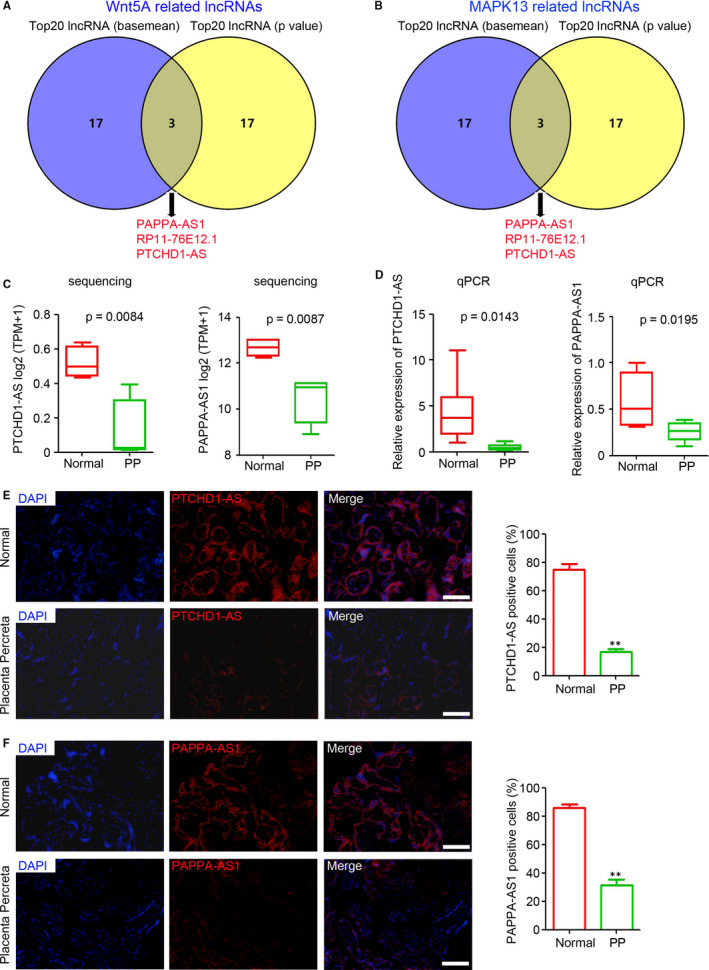
FIGURE 5.

Down‐regulation of lncRNA PTCHD1‐AS and PAPPA‐AS1 in placenta percreta (PP). Venn analysis of the top 20 (A) Wnt5A‐related lncRNAs and (B) MAPK13‐related lncRNAs, ranked by basemean and P value. (C and D) lncRNA PTCHD1‐AS and PAPPA‐AS1 levels in placental tissue of normal and PP groups, as determined by RNA sequencing (C) and qPCR (D, n = 6 per group; **P < 0.01 compared with the normal group. GAPDH was used as a loading control). (E and F) FISH analysis of lncRNA PTCHD1‐AS and PAPPA‐AS1 expression in placental tissue of normal and PP groups. The positive cells in each sample were analysed (n = 6 per group; **P < 0.01, compared with the normal group). Scale bar = 100 μm
