
FIGURE 4.
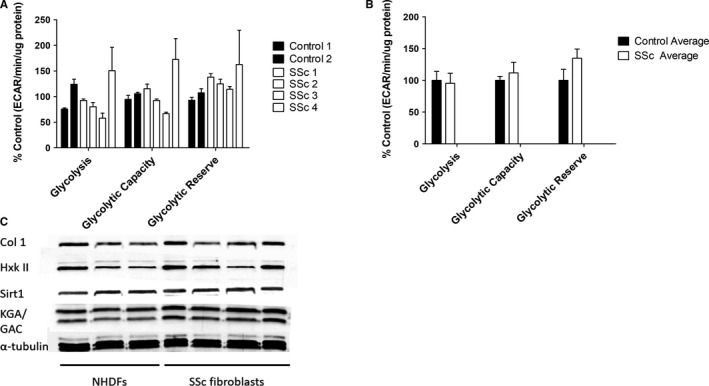
Glycolysis and glutaminase expression in SSc patient derived dermal fibroblasts. Glycolytic parameters for dermal fibroblasts from healthy controls (n = 3) and SSc patients (n = 4) were measured using a glycolysis stress test, displayed individually (A) and as disease and control averages (B). Statistical analysis was performed using 1‐way ANOVA. C, Expression of glutaminase (KGA/GAC), hexokinase II, collagen I and α‐tubulin in SSc and healthy control fibroblasts was analysed by Western blotting. Error bars represent the mean (n = 3) ±SEM