
FIGURE 6.
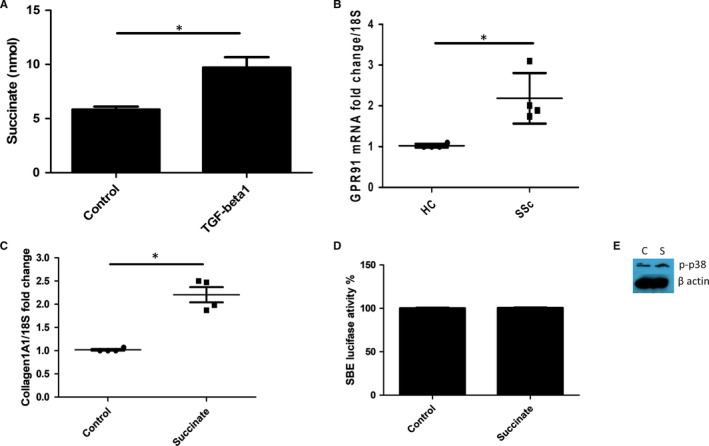
TGF‐β1 up‐regulates succinate levels. A, Healthy dermal fibroblasts were stimulated with TGF‐β1 or not, and after 36 h succinate was quantified colorimetrically * significantly different compared with controls P = .0002; Student's t test. Data are the mean and SD n = 4. B, GPR91 expression is higher in SSc dermal fibroblasts *Significantly different compared with healthy controls P = .0096 n = 4 donors. C, Collagen1A1 was quantified after succinate incubation (5 mmol/L) using qRT‐PCR, Data are normalized to the housekeeping gene 18S and shown as fold change compared with control. Data are mean and SD * significant difference compared with control P = .0005 Student's t test; n = 4. D, No significant difference in SMAD activation after succinate incubation. Luciferase activity is determined after stimulation with succinate. Data are normalized to untreated control set to 100% luciferase set to Renilla luciferase for transfection efficacy n = 3. E, Western blot of healthy dermal fibroblast incubated with succinate after 15 min and the cells were probed with phosphorylated p38 and re probed with β‐actin for equal loading. C = control untreated S = Succinate 5 mmol/L