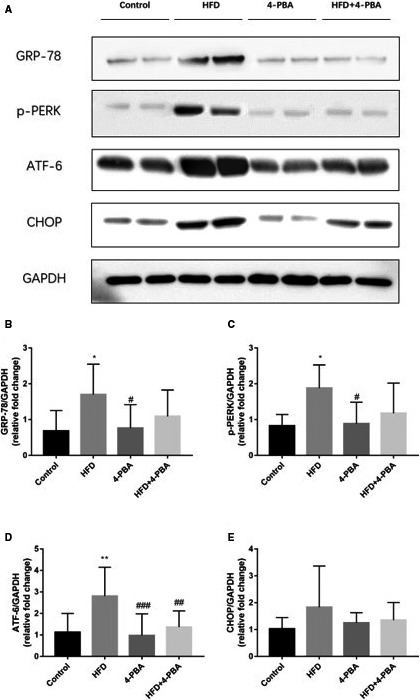
Figure 6.

ERS key markers protein expression of the control group (n = 7), the HFD group (n = 10), the 4‐PBA group (n = 8) and the HFD + 4‐PBA group (n = 15). A, Representative Western blotting bands of GRP‐78, p‐PERK, ATF‐6, CHOP. B, Quantitative analysis of GRP‐78 expression. C, Quantitative analysis of p‐PERK expression. D, Quantitative analysis of ATF‐6 expression. E, Quantitative analysis of CHOP expression. *P < 0.05 vs Control; **P < 0.01 vs Control; # P < 0.05 vs HFD; ## P < 0.01 vs HFD; ### P < 0.005 vs HFD
