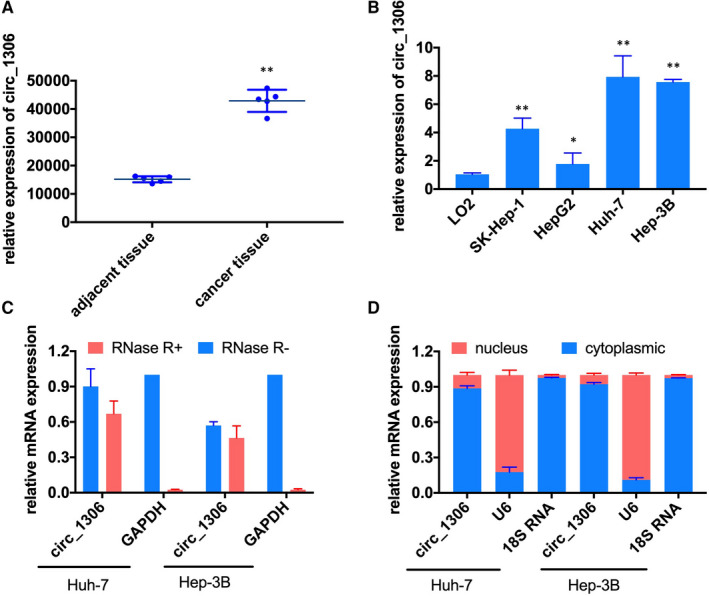
FIGURE 1.

The relative expression of circ_1306 in HCC tissues and cell lines. (A) The expression of circ_1306 in HCC tissues (n = 5) and adjacent normal tissues (n = 5) in GSE94508. **P < 0.01 compared to adjacent normal tissues. (B) The relative expression of circ_1306 in the human normal liver cell line (L02) and HCC cell lines (SK‐HEP‐1, Hep G2, Huh‐7, and Hep 3B) was determined by qPCR. *P < 0.05 and **P < 0.01 compared to L02. (C) The expression of circ_1306 and GAPDH in Huh‐7 and Hep 3B cells was tested by qPCR after RNase R treated or untreated. (D) The distribution of circ_1306 in Huh‐7 and Hep 3B cells was detected by a nuclear and cytoplasmic separation assay. All data represent the mean ± SD
