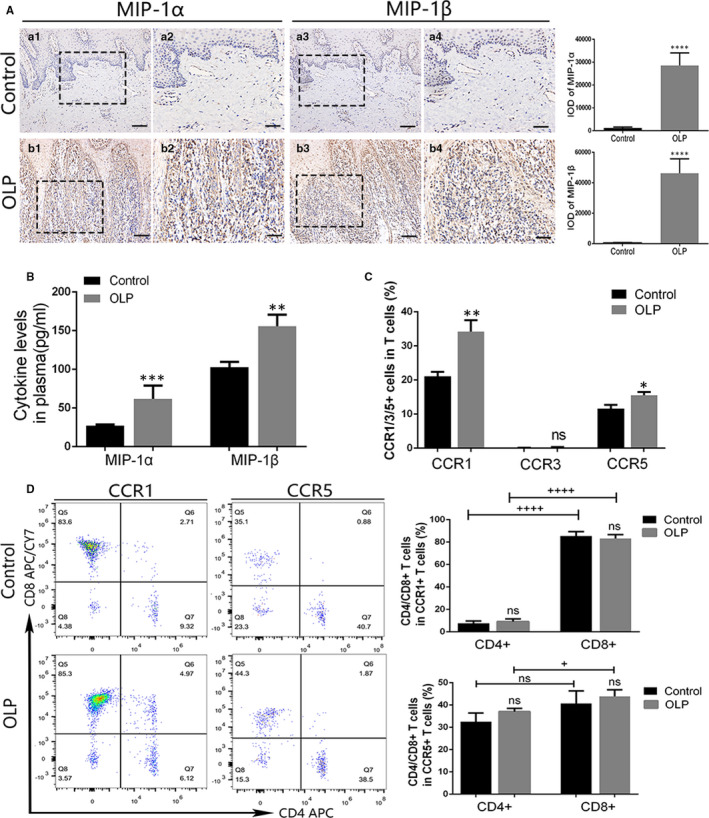
FIGURE 4.

The expression of macrophage inflammatory protein (MIP)‐1α/β in oral lichen planus (OLP) and the expression of CCR1/3/5 in OLP peripheral T cells. A, The expression of MIP‐1α/β in OLP (n = 14) and control (n = 9) mucosal tissues was identified by IHC and assessed by IOD value. Magnification: a1, a3, b1, b3, 20×, scale bar, 50 μm; a2, a4, b2, b4, 40×, scale bar, 25 μm. B, Cytokine levels of MIP‐1α and MIP‐1β in the plasma of OLP (n = 12) and control (n = 8) were detected by ELISA. C, Membrane expression of CCR1/3/5 on OLP (n = 10) and control (n = 8) peripheral T cells was measured using flow cytometry. D, The proportion of CD4+ and CD8+ T cells in CCR1+ or CCR5+ T cells was analysed via flow cytometry. +, difference between the two groups; *, vs control group. + P, *P < 0.05; **P < 0.01; ***P < 0.001; ++++ P < 0.001. ELISA, enzyme‐linked immunosorbent assay; IHC, immunohistochemistry; IOD, integrated optical density; ns, no significant difference
