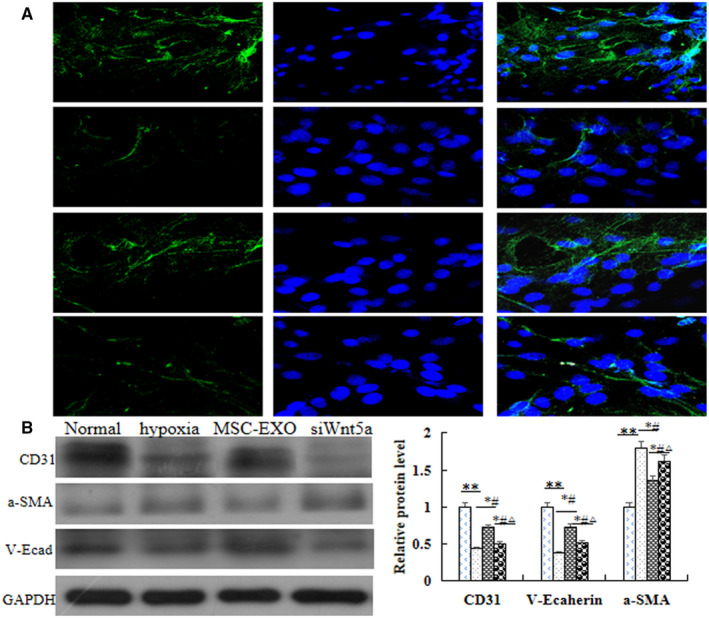
Figure 6.

Effect of MSC‐EXO on hypoxia‐induced EndMT in PAECs. A, Immunofluorescence analysis of a‐SMA and V‐E cadherin. B, Protein expression and comparative analysis of CD31, a‐SMA and V‐E cadherin in PAEC. *P < 0.05 vs Normal group; # P < 0.05 vs hypoxia group; △ P < 0.05 vs MSC‐EXO group. Red bar = 100 µm
