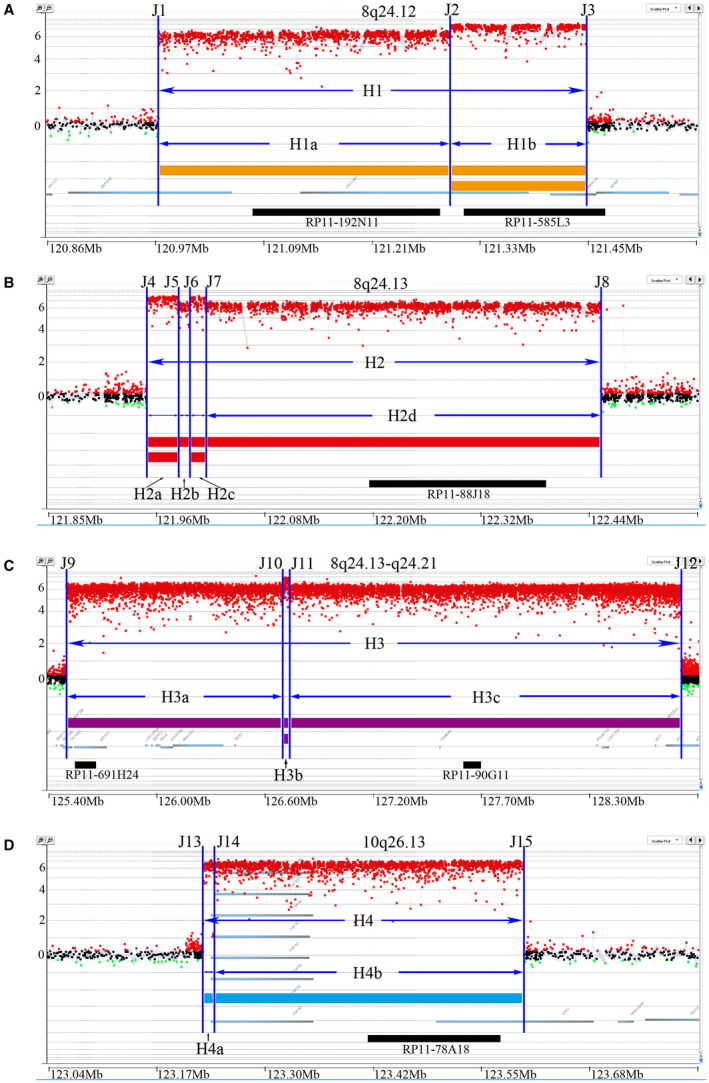
Figure 1.

Four amplified regions were determined in NCI‐H716 cells with an Agilent array‐CGH chip with high‐density probes. The yellow strip in A, red strip in B, purple strip in C and blue strip in D represented each corresponding amplification region—H1, H2, H3 and H4. The majority of the copy numbers were around 26, shown with single line. The majority of the copy numbers were around 27, shown with double lines. X‐axis represented chromosome coordinates. Y‐axis represented log2 ratios of the copy number normalized by normal controls, showing distinct sub‐regions with different overall copy numbers. Blue vertical lines depict boundary positions for each amplicon. The position of the BACs was marked with black strip
