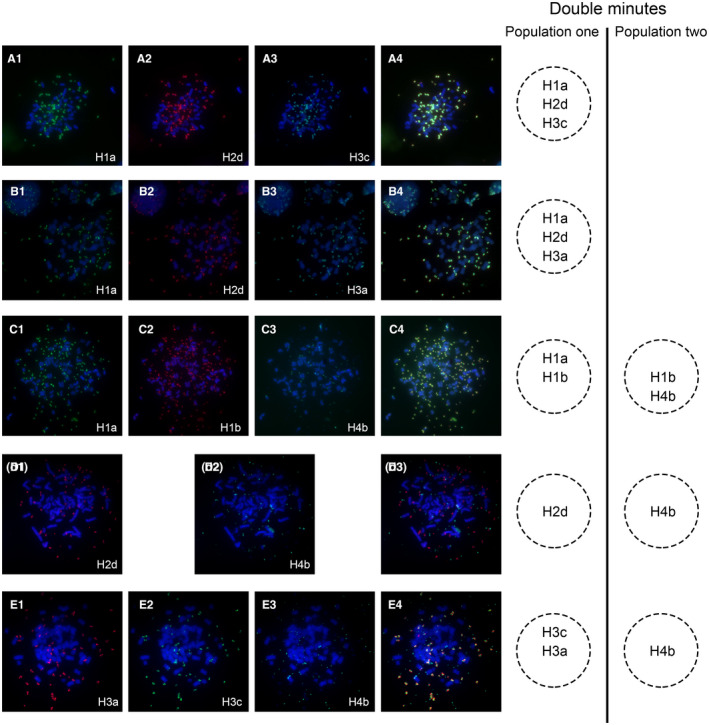
Figure 2.

The heterogeneous composition of two subpopulations of DMs determined by M‐FISH analysis. (A) Co‐hybridization of RP11‐192N11 (green) (A1)‐H1a, RP11‐88J18 (red) (A2)‐H2d and RP11‐90G11 (light blue) (A3)‐H3c showed overlapping signals (A4) on the same DMs. (B) RP11‐192N11 (green) (B1)‐H1a, RP11‐88J18 (red) (B2)‐H2d and RP11‐691H24 (light blue) (B3)‐H3a showed overlapping signals (B4) in the same DMs. (C) Co‐localization of RP11‐192N11 (green) (C1)‐H1a and RP11‐585L3 (red) (C2)‐H1b; overlapping hybridization of RP11‐585L3 (red) (C2)‐H1b and RP11‐78A18 (light blue) (C3)‐H4b was shown in the overlay image (C4). (D) Hybridization of RP11‐88J18 (red) (D1)‐H2d and RP11‐78A18 (green) (D2)‐H4b disclosed that two BACs located on different populations of DMs (D3). (E) Hybridization of RP11‐691H24 (red) (E1)‐H3a and RP11‐90G11 (green) (E2)‐H3c demonstrated their co‐localization on the same DMs, but no overlapping signals with RP11‐78A18 (light blue) (E3)‐H4b was shown in the overlay image (E4)
