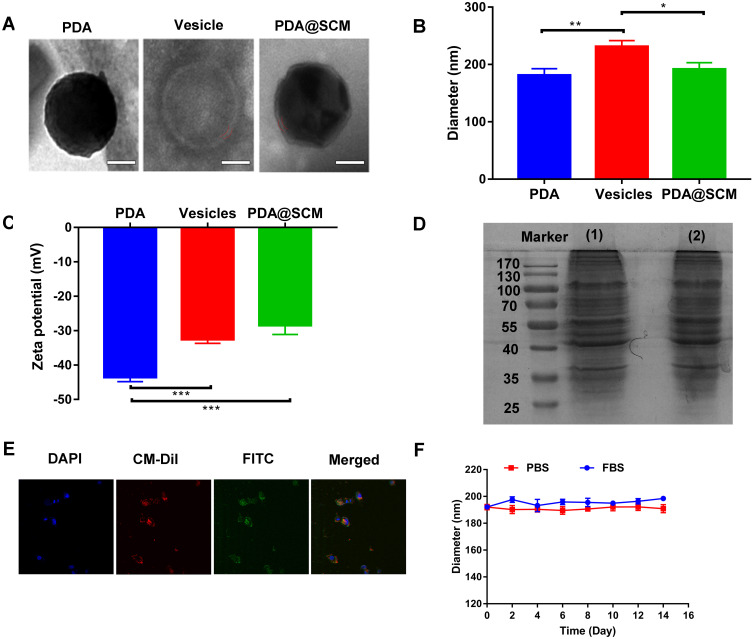
Figure 2.
Characterization of PDA@SCM NPs. (A) TEM images of synthesized PDA NP (left), SCM vesicle (middle) and PDA@SCM NPs (right). Scale bar = 50 nm. (B) Hydrodynamic size of PDA NPs, SCM vesicles, and PDA@SCM NPs. (C) Surface charge of PDA NPs, SCM vesicles and PDA@SCM NPs. (D) SDS-PAGE-based protein analyses of (1) SCM and (2) PDA@SCM NPs. (E) CLSM images of PDA@SCM NPs illustrating colocalization of PDA NPs (FITC channel) and SCMs (CM-Dil channel). Scale bar = 50 μm. (F) Stability of PDA@SCM NPs in PBS and FBS by measurement of particle size. *p < 0.05, **p < 0.01, ***p < 0.001.

