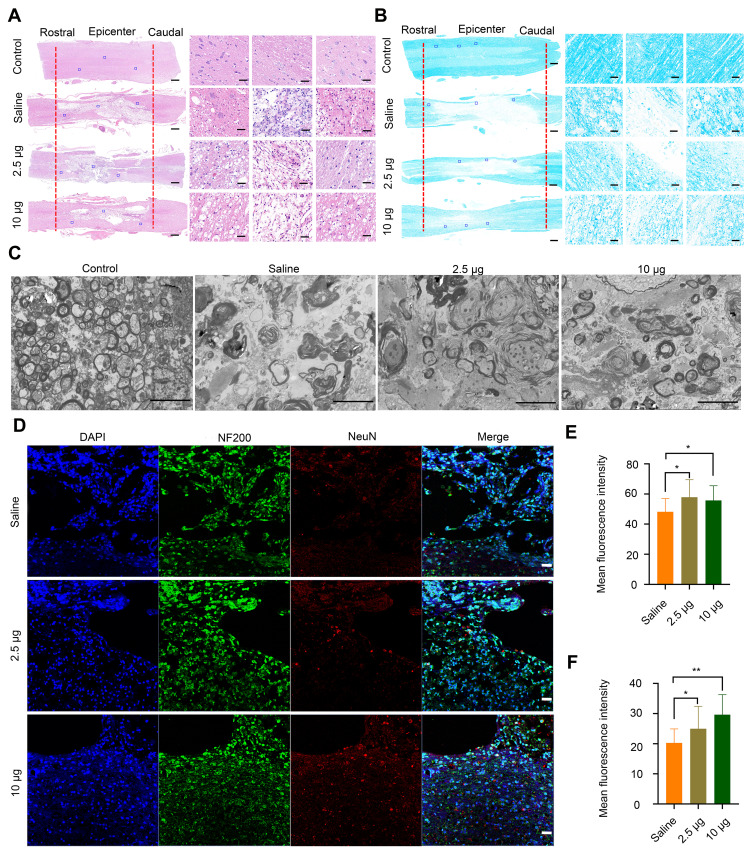
Figure 5.
Histomorphological changes at 8 weeks post-injury in vivo. (A) Images of spinal cord tissue after staining with H&E, shown at 2X (left, scale bar = 500 μm) and 20 X magnification (right, scale bar = 50 μm). The images on the right are the corresponding enlarged views of the areas indicated by blue squares in the left images. The red lines indicate the edge of the lesion sites. (B) LFB staining of myelin sheaths is shown at 2X (left, scale bar = 500 μm) and 20X magnification (right, scale bar = 50 μm). The images on the right are the corresponding enlarged views of the areas indicated by blue squares in the left images. The red lines indicate the edge of the lesion sites. (C) Representative TEM images showing the ultrastructure of myelin sheaths in different groups. Scale bar = 5 μm. (D) Double-staining of the slices with anti-NF200 and anti-NeuN antibodies. Scale bar = 50 μm. (E) Quantitative analysis of mean fluorescence intensity of NF200 staining in Figure 4D, * P< 0.05, in comparison with saline group. (F) Quantitative analysis of mean fluorescence intensity of NeuN staining in Figure 4D. * P < 0.05 and ** P < 0.01, in comparison with saline group.

