
Fig. 2.
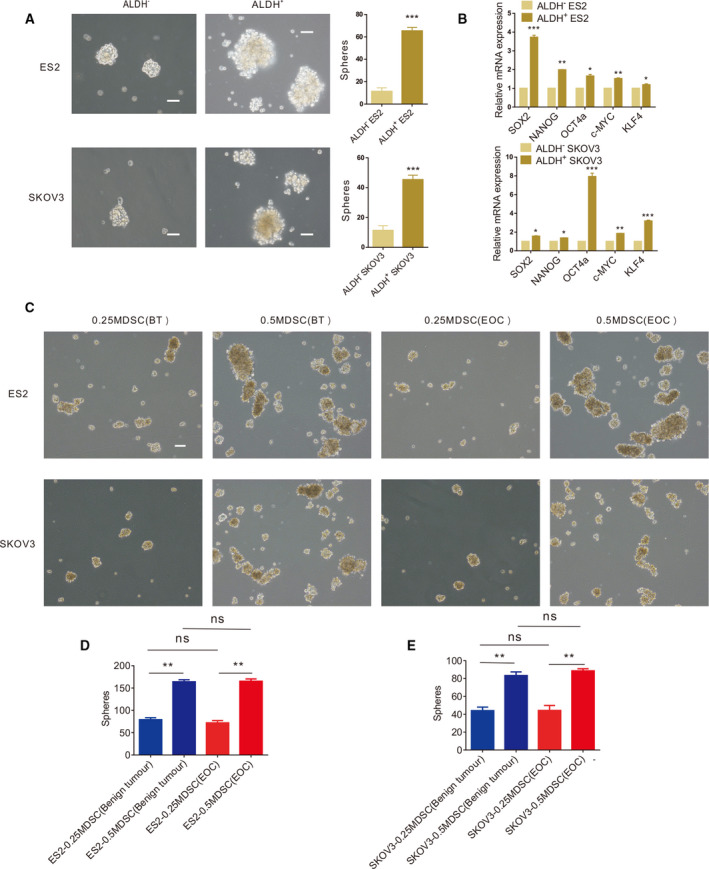
ALDH+ EOC cells are EOC stem cells. (A) Sphere formation assays using ALDH+ and ALDH‐ ES2 and SKOV3 cells. Scale bar, 50 μm. (B) qRT‐PCR analysis of core stem cell molecule expression levels in ALDH+ and ALDH‐ ES2 and SKOV3 cells. (C) Sphere formation assays using ES2 and SKOV3 cells cultured with MDSCs from different groups of patients. Scale bar, 50 μm. (D, E) Statistical analysis of the number of ES2 and SKOV3 tumour spheres with MDSCs from different groups of patients. All data were analysed using Student’s t‐test and are expressed as the mean ± SD. Experiments were performed in triplicate with MDSCs from three different patients. Symbols represent statistical significance (*P < 0.01; **P < 0.001; and ***P < 0.0001).