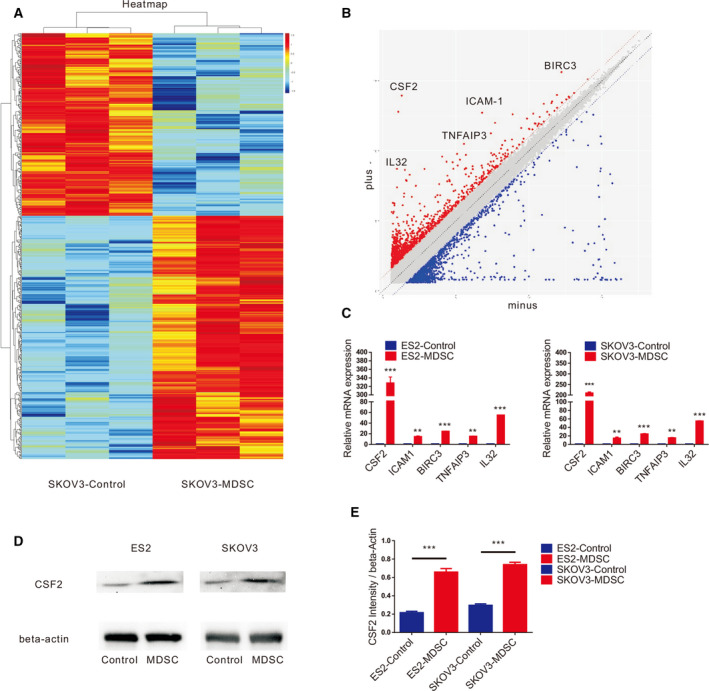
Fig. 4.

MDSCs stimulate CSF2 expression in EOC. (A) Microarray analysis of differentially expressed genes for SKOV3 cells based on coculture with MDSCs. (B) Scatter diagram analysis of discriminating genes for SKOV3 cells based on coculture with MDSCs. (C) qRT‐PCR analysis of CSF2, ICAM‐1, IL‐32, BIRC3 and TNFAIP3 expression in ES2 and SKOV3 cells cultured with or without MDSCs. (D, E) Western blot analysis of CSF2 expression in ES2 and SKOV3 cells cultured with or without MDSCs. All data were analysed using Student’s t‐test and are expressed as the mean ± SD. Experiments were performed in triplicate with MDSCs derived from three different patients, and statistically significant differences are presented as follows: **P < 0.001 and ***P < 0.0001.
