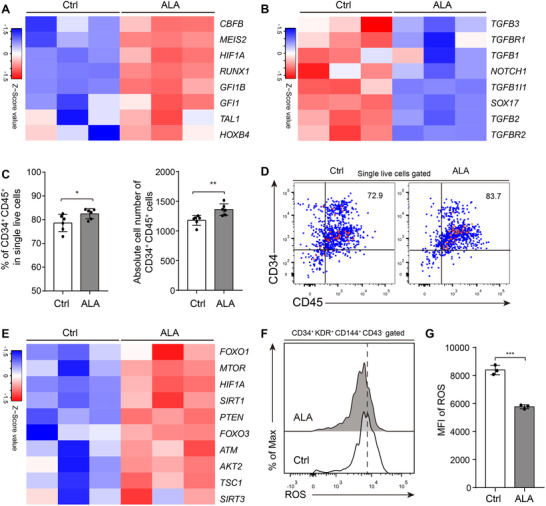
FIGURE 4.

ALA promotes endothelial‐to‐hematopoietic transition progress. Heatmaps show the expression of endothelial‐to‐hematopoietic transition positive regulated genes (A) and endothelial‐to‐hematopoietic transition negative regulated genes (B). (C) CD34+ CD45+ hematopoietic stem/progenitor cells percentages or absolute cell numbers derived from 2500 hemogenic endothelium cells were calculated. Sorted hemogenic endothelium cells were seeded onto AGM‐S3 stroma cells and cultured for 4 days. (D) Representative flow cytometry results of CD34+ CD45+ hematopoietic stem/progenitor cells derived from CD34+ KDR+ CD43− hemogenic endothelium cells. Numbers in quadrants indicate percentages. (E) Heatmaps represent the expression of ROS sensor‐responsive genes. (F) Flow cytometry analysis of ROS levels in CD34+ CD43− KDR+ CD144+ hemogenic endothelium cells from normal or ALA‐treated cocultures on Day 8. (G) Mean fluorescence intensity (MFI) was calculated. Each symbol (C and G) represents an individual replicate; small horizontal lines indicate the mean (±sd). Columns represent the indicated replicates of each population (A, B, and E).The data in the bar graphs in (C), and (G) are presented as the mean ± sd. An unpaired Student's t‐test (2‐tailed) was performed. N = 3 replicates; * P < 0.05, ** P < 0.01, *** P < 0.001, **** P < 0.0001; ns, not significant
