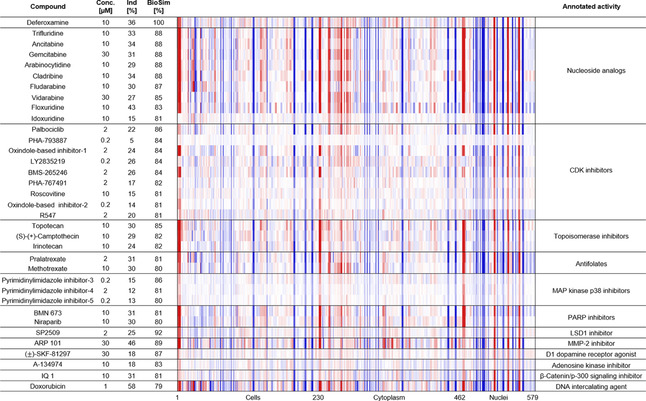
Figure 3.

Morphological fingerprints of annotated references with high biosimilarity to DFO (>75 %). The top line of the heatmap profile is set as a reference fingerprint (100 % BioSim) to which the following fingerprints are compared. The set of 579 parameters is divided in parameters related to the cell (1–229), cytoplasm (230–461) and nuclei (462–579). Values were normalized to the DMSO control. Blue color: decreased parameter, red color: increased parameter. The structures of references not depicted in the main figures are shown in Table S4.
