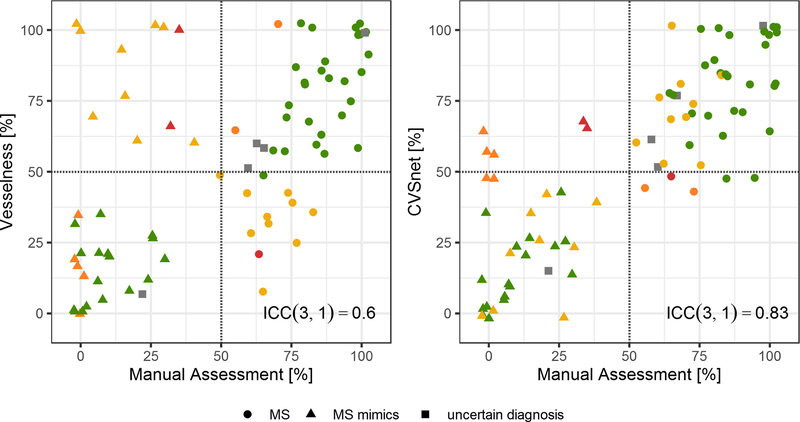
Figure 4 – Patient-wise manual and automated assessment using vesselness filter and CVSnet.
Percentage of CVS+ lesions for each patient, comparing the vesselness filter and CVSnet approaches with respect to manual assessment (ground truth). Different types of diagnoses: MS (circle), MS mimics (triangle), and uncertain diagnosis (square). Colors represent the different scenarios for correct and incorrect disease prediction from both algorithms based on the 50% perivenular rule: green – both algorithms predicted correctly; yellow – only CVSnet predicted correctly; orange – only Vesselness filter predicted correctly; red – both algorithms predicted incorrectly; grey – uncertain diagnosis. The red dashed line indicates the 50% rule. While the percentages diverge somewhat from those estimated manually, the CVSnet approach tends to yield estimates leading to a diagnosis consistent with that derived from manual assessment with an ICC(3,1)=0.83.

