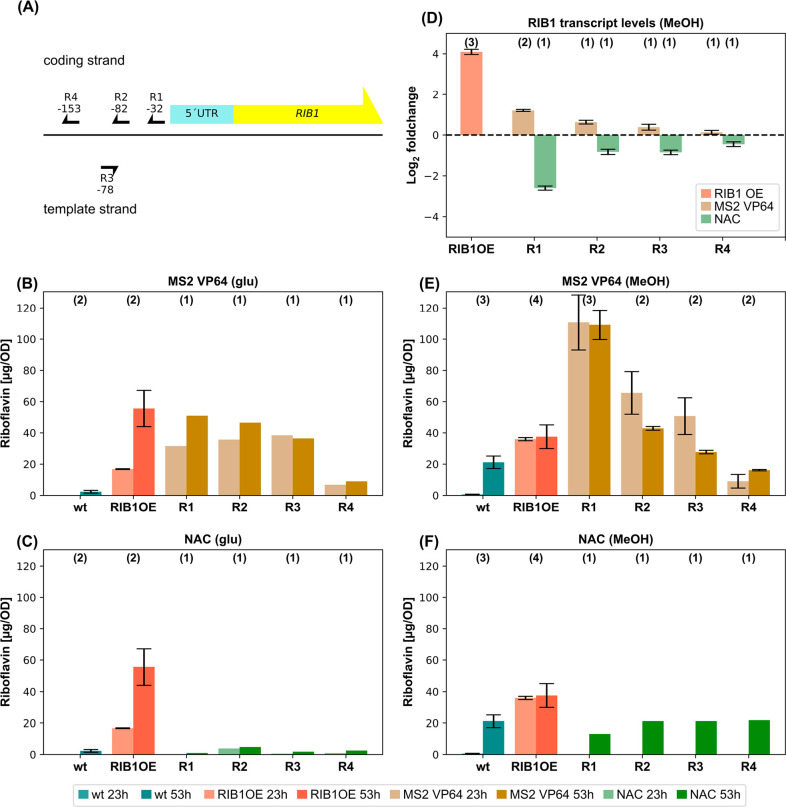
Figure 4.
Targeting the RIB1 gene with the scgRNA/dCas9 system. (A) Overview of the tested target sequences (R1–R4). Arrowheads indicate the position of the PAM sequence and the positions of the last nucleotide of the PAM sequences in respect to the TSS. Riboflavin productivities after 23 and 53 h of (B) MS2 VP64 and (C) NAC strains cultivated using glucose surplus conditions. (D) Log2 fold changes of relative transcript levels of the RIB1 gene compared to the wt measured after 23 h of cultivation using MeOH conditions. Riboflavin productivities measured after 23 and 53 h of (E) MS2 VP64 and (F) NAC strains cultivated using MeOH conditions. The number of biological replicates is indicated on top of each bar. Error bars indicate the standard deviation of the biological replicates for B, C, E, and F and the sum of squared errors of the Ct values of the target gene and the housekeeping gene of all technical replicates (4 per biological replicate) for D.

