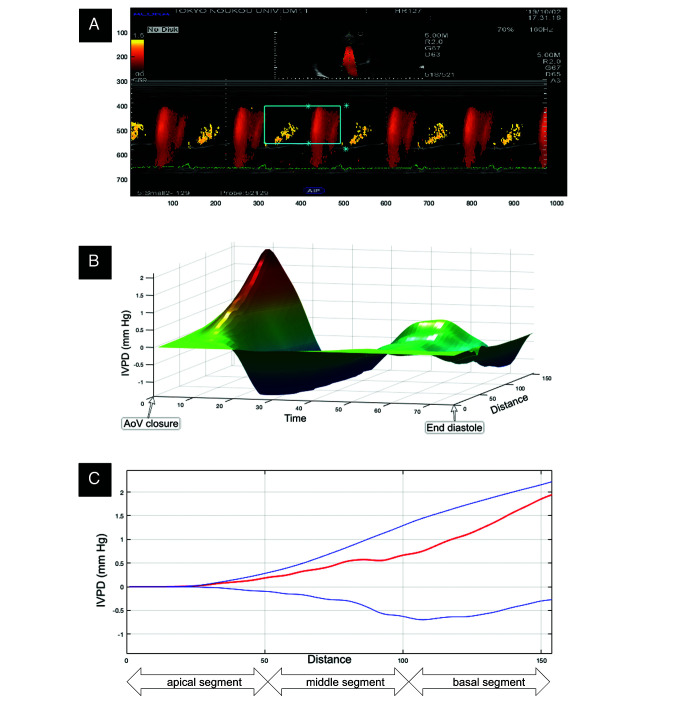
Figure 1.
The mitral inflow patterns are colorized by using pulsed-wave Doppler along the flowing of the blood into the LV and captured during M-mode (A) The IVPD is calculated by the specific algorithm of MATLAB software, then the 3D (3D) temporal and spatial profile of the IVPD is generated (B) In 3D image, the x, y and z axes represent time, IVPD, and distance, respectively. Subsequently, the IVPD in early diastole are identified (C) The top (blue), middle (red), and bottom (blue) lines represent inertial, total, and convective IVPD, respectively; AoV aortic valve; IVPG = IVPD ¸ distance (mm Hg/cm).

