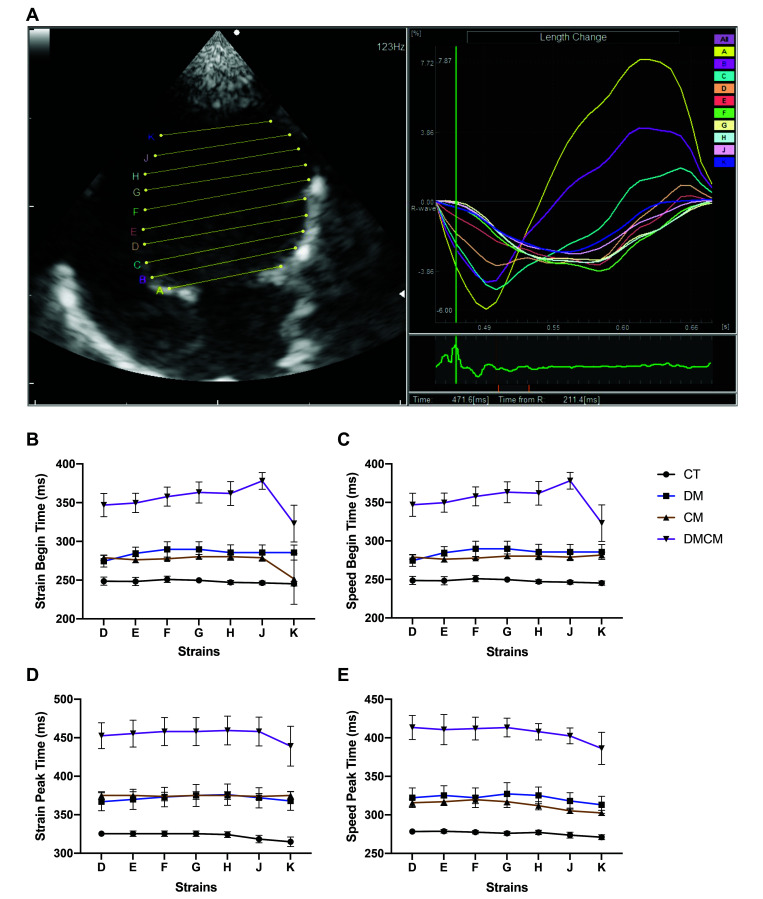
Figure 5.
(A) 2D tissue tracking (2DTT) is analyzed by using the DAS-RS1 software 6.0v (Aloka). Each strain (A, B, C, D, E, F, G, H, J, and K) is drawn horizontally to the mitral valve for tracking the ability of relaxation (diastolic performance) of the LV. The 2DTT results are illustrated separately at begin (B and C) and peak (D and E) times. CT control group, DM diabetic group, CM cardiomyopathic group, DMCM diabetic and cardiomyopathic group.

