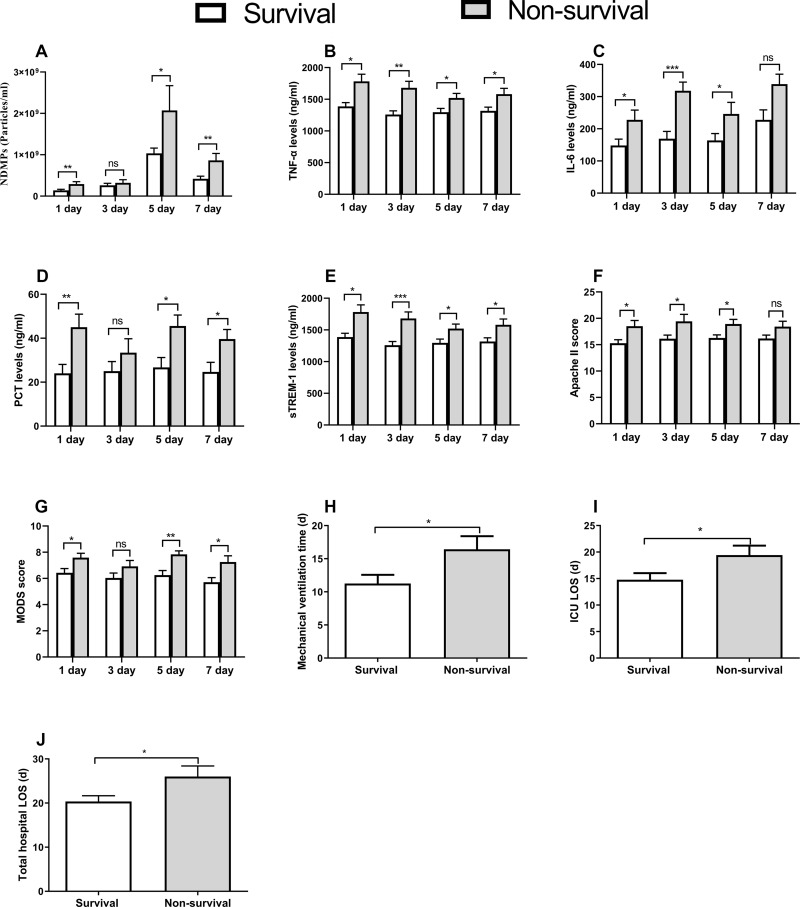
Figure 5.
Comparisons between surviving and non-surviving patients of all measurements and clinical outcomes. Plasma concentration of NDMPs (A), TNF-α (B), IL-6 (C), PCT (D), sTREM-1 (E), Apache II score (F) and MODS score (G) on days 1 (54 cases in survival group versus 26 cases in non-survival group), 3 (52 versus 22 cases), 5 (49 versus 17 cases) and 7 (45 versus 14 cases); and mechanical ventilation time (H), and ICU LOS (I) and total hospital LOS (J) in survival and non-survival groups. Data were mean ± SD and analyzed by t-test. *p<0.05, **p<0.01, ***p<0.001 compared with sepsis group.

