
FIGURE 1.
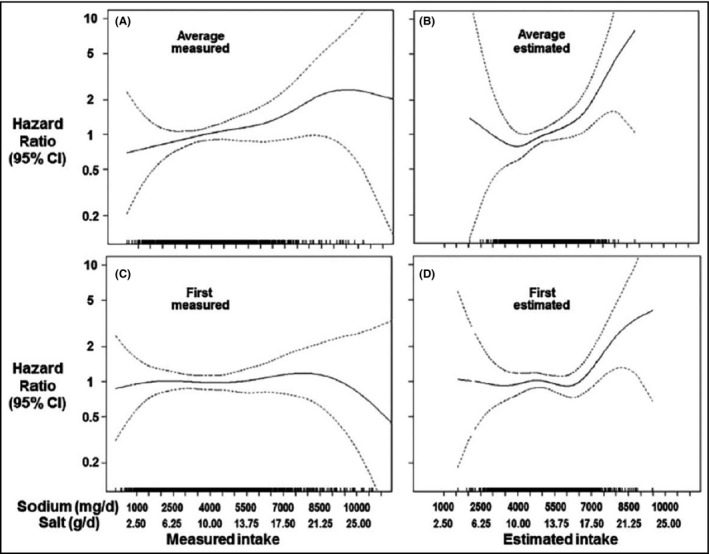
Impact of sodium measurement on perceived relationship between usual sodium intake and CVD. Source: He FJ, Campbell NRC, Ma Y, MacGregor GA, Cogswell ME, Cook NR. Errors in estimating usual sodium intake by the Kawasaki formula alter its relationship with mortality: implications for public health. Int J Epidemiol. 2018;47(6):1784‐1795. 17 The four graphs represent different spline plots on the association between sodium intake and all‐cause mortality in the Trials of Hypertension Prevention (TOHP) study after 20 years of follow‐up. In each graph, the measurement of sodium intake varies, resulting in a change in the relationship between sodium intake and all‐cause mortality. Sodium intake is measured as (A) the gold standard of the average sodium from 3 to 7 collections of 24‐h urine, (B) the average of 3‐7 estimated 24‐h urine excretion based on applying the Kawasaki formula to the sodium concentration, (C) the sodium measured in the first 24‐h urine collection, and (D) the sodium estimated from a applying the Kawasaki formula to the sodium concentration in the first 24‐h urine collection. Reprinted with permission