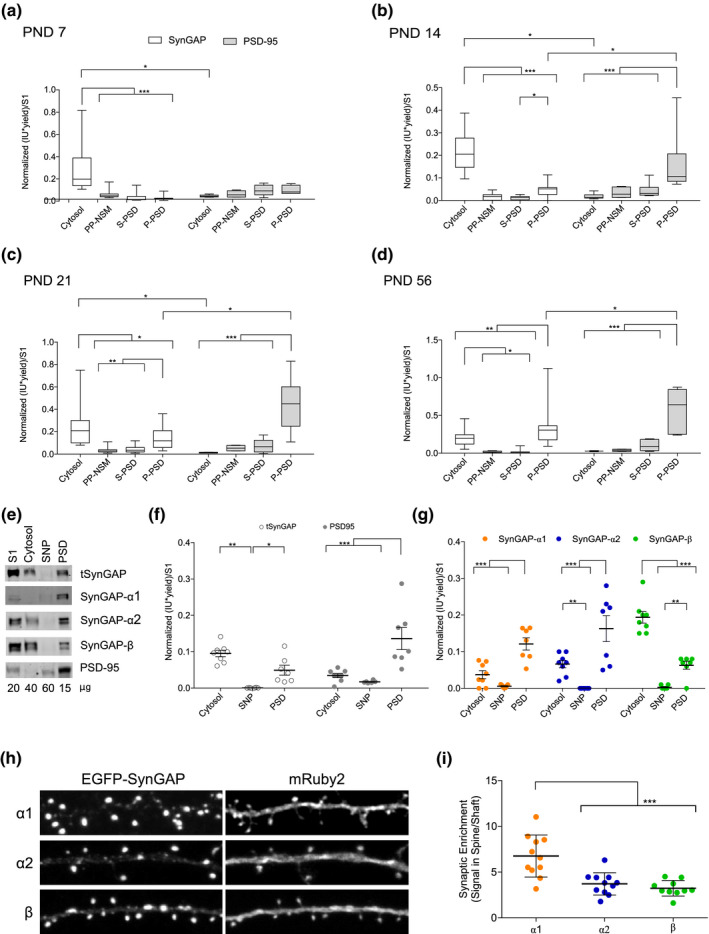
FIGURE 5.

Subcellular distribution of total SynGAP (tSynGAP) and PSD‐95 in cortex from four life stages and adult hippocampus. (a–d) box and whiskers plots representing the mean of normalized immunoblot intensity data (see Figure S5b) from different subcellular fractions. White boxes present tSynGAP data and gray boxes PSD‐95 data. (N: postnatal day [PND]7 6–18, PND14 6–21, PND21 9–18, PND56 6–15). N indicates total number of technical replicates performed using cortical samples coming from six different mice. The standard error of the mean (SEM) is also shown. Mean differences were analyzed by two‐way ANOVA followed by Fisher's LSD post‐hoc test, ***p < .001, **p < .01, and *p < .05. Subcellular fractions correspond with: cytosol; NSM, non‐synaptic membranes; SNP, synaptic non‐PSD and PSD, postsynaptic density. Life stages investigated are: PND7 (a), PND14 (b), PND 21 (c), and PND56 (d). (e) Immunoblots presenting subcellular distribution of total SynGAP (tSynGAP), its isoforms, and PSD‐95 in adult (PND56) hippocampus. Subcellular fractions investigated: Homogenate without the nuclear fraction (S1); cytosol; SNP, synaptic non‐PSD and PSD, postsynaptic density. (f) Dot plot with the mean of normalized immunoblot intensity data of tSynGAP (white dots) and PSD‐95 (grey dots) in the subcellular fractions obtained from adult hippocampus (N: PND63 6–9 technical replicates using six biological replicates resulting from a pool of two mouse hippocampus per replica). (g) Dot plot with mean of normalized immunoblot intensity data of SynGAP isoforms containing α1, α2, and β C‐terminal variants in the subcellular fractions obtained from adult hippocampus. N: PND63 6–8 technical replicates using six biological replicates resulting from a pool of the hippocampus from two mice per replica. The standard error of the mean (SEM) is also shown. Mean differences were analyzed by one‐way ANOVA followed by Tukey's post‐hoc test ***p < .001, **p < .01, and *p < .05. (h) Mouse Syngap1 KO hippocampal neurons (DIV17) transfected with constructs expressing enhanced green fluorescent protein (EGFP) tagged SynGAP C‐terminal isoforms (α1, α2, and β) along with mRuby2 (cell‐fill). (i) Synaptic enrichment is calculated as the ratio of EGFP signal present in dendritic spines versus dendritic shaft. n = 30 spines form 9–11 neurons for each isoform analysis. Error bars indicate SEM. Mean differences were assessed by one‐way ANOVA followed by Tukey's multiple comparison test, ***p < .0001
