
FIGURE 6.
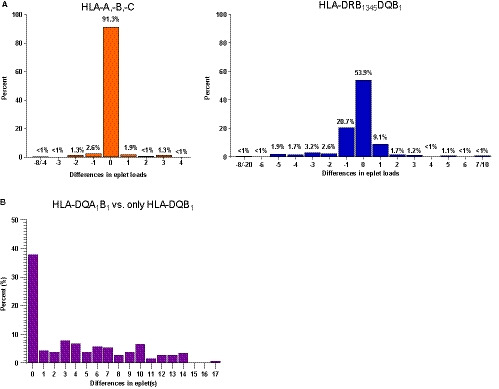
Differences in the eplet mismatch repertoire when using incomplete or inferred donor HLA genotypes. The differences are calculated in eplet(s) and the x‐axis shows the difference in eplets between the eplet mismatch loads. A, Differences in the eplet mismatch loads between true vs inferred HLA genotypes for HLA‐A/‐B/‐C and DRB1345/DQB1. The differences refer only to the mismatch load, not to the eplet mismatch repertoire. Considering the differences in the mismatched eplet repertoire instead of the total number of mismatched eplets, the agreement between the inferred and the real 2F‐HR genotypes was 75.3% for class I and 35.4% for class II. B, Differences in the eplet mismatch loads between the eplet load of the complete DQ (DQA1/DQB1) molecule vs the eplet mismatch load calculated only for DQB1 locus. 2F‐HR, second field high‐resolution; HLA, human leukocyte antigen [Color figure can be viewed at wileyonlinelibrary.com]