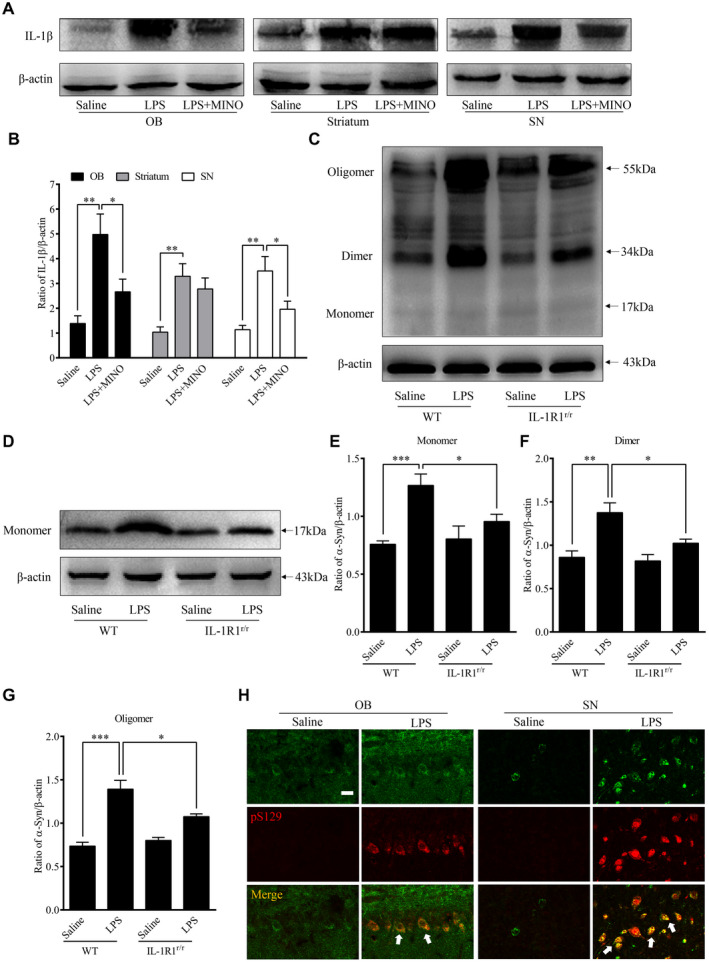
Figure 2.

Activated microglia‐induced α‐Syn overexpression and aggregation in the OB. A. Representative Western immunoblot images of IL‐1β from the OB, striatum and SN of animals treated with LPS or saline infusion. B. Comparison of normalized IL‐1β expression levels in the OB, striatum and SN. C. Representative Western blot images of α‐Syn aggregation in the OB of WT (GR/GR) and IL‐1R1r/r mice. D. Representative Western blot image of α‐Syn (17 kDa) in the OB of WT (GR/GR) and IL‐1R1r/r mice. E. Comparison of normalized fibrillar α‐Syn aggregation levels (55 kDa) in the OB of WT and IL‐1R1r/r mice. n = 6; Comparison of normalized oligomeric α‐Syn aggregation levels (34 kDa) in the OB of WT and IL‐1R1r/r mice. n = 6; G. Comparison of normalized monomeric α‐Syn aggregation levels (17 kDa) in the OB of WT and IL‐1R1r/r mice. n = 6. H. Representative images of IL‐1R1 (HA) and pS129 α‐Syn positive staining in the OB and SN. β‐actin was used as a loading control. One‐way ANOVA analysis followed by LSD multiple comparison was used to contrast the groups’ difference. n = 6 *P < 0.05, **P < 0.01, ***P < 0.001.
