FIGURE 3.

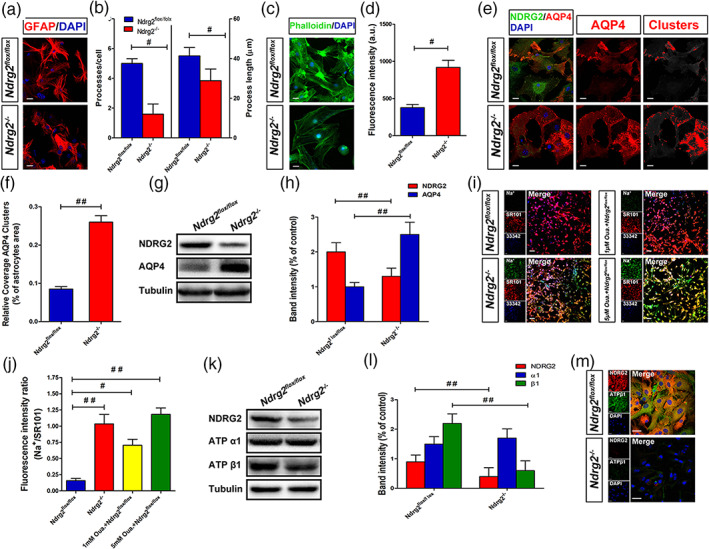
NDRG2 maintains the polarity of astrocytes under physiological conditions. (a) Primary cultured Ndrg2 −/− astrocytes and control astrocytes were fixed and subjected to immunostaining for GFAP (red) and DAPI (blue), scale bar = 20 μm. (b) Number/cell and length of the major processes of at least 25 astrocytes. # p < .05 versus control astrocytes. (c) Primary cultured Ndrg2 −/− astrocytes and control astrocytes were fixed and subjected to immunostaining for phalloidin (green) and DAPI (blue), scale bar = 20 μm. (d) Green fluorescence intensity of phalloidin in each group. Data are presented as the mean ± SEM of three independent experiments, each performed in five fields of view. # p < .05 versus control astrocytes. (e) Immunofluorescence was used to detect NDRG2 (green) and AQP4 (red) in Ndrg2 −/− astrocytes and control astrocytes, and nuclei were labeled blue by DAPI. AQP4 assembled in clusters was detected in Ndrg2 −/− astrocytes. Colorized AQP4 clusters (right, red) depict regions where the AQP4 immunoreactivity intensity was above the threshold value. Scale bar = 20 μm. (f) Quantification of relative coverage by AQP4 clusters in Ndrg2 −/− astrocytes and control astrocytes. Data are presented as the mean ± SEM of three independent experiments, each performed in 5 fields of view. ## p < .01 versus control astrocytes. (g) Representative Western immunoblots for NDRG2, AQP4 and tubulin of Ndrg2 −/−astrocytes and control astrocytes. (h) Densitometric quantification of NDRG2 and AQP4 protein expression is shown normalized to tubulin. Data are expressed as the mean ± SEM of three independent experiments. ## p < .01 versus control astrocytes. (i) Representative fluorescence images showing CoroNa Green (sodium indicator) and SR101 (Na+‐insensitive fluorescent dye) trapped inside astroglial cytoplasm and counterstained with Hoechst 33342. Scale bar = 50 μm. (j) Fluorescence intensity ratio of CoroNa Green to SR101 in each group shown in (i). Data are presented as the mean ± SEM of three independent experiments, each performed in five fields of view. # p < .05, ## p < .01 versus control astrocytes. (k) Representative Western immunoblots for NDRG2, ATP α1, ATP β1, and tubulin of Ndrg2 −/− astrocytes and control astrocytes. (l) Densitometric quantification of NDRG2, ATP α1, and ATP β1 protein expression is shown normalized to tubulin. Data are expressed as the mean ± SEM of three independent experiments. ## p < .01 versus control astrocytes. (m) Primary cultured astrocytes were immunolabeled for NDRG2 (red) and ATP β1 (green), and nuclei were labeled blue by DAPI. Scale bar = 30 μm [Color figure can be viewed at wileyonlinelibrary.com]
