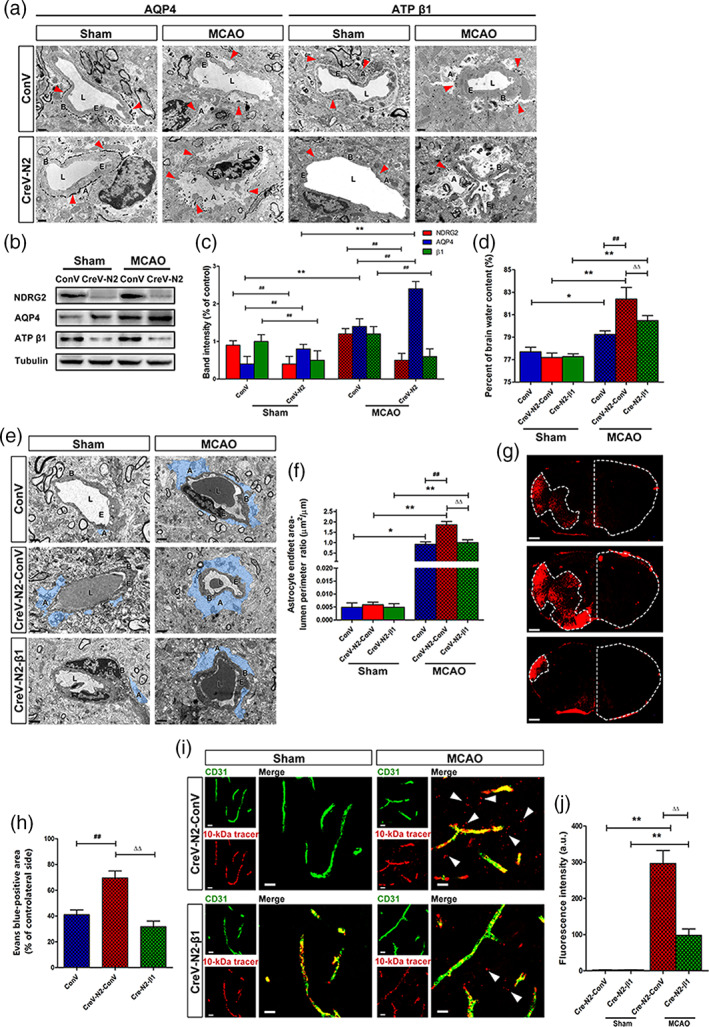
FIGURE 4.

Na+‐K+‐ATPase β1 restoration rescues NDRG2 deficiency‐mediated BBB disruption and brain edema after stroke. (a) Representative immunoelectron microscopy images of cerebral vessels in the cortices of the sham groups or penumbra zones of the MCAO groups. Red arrowheads indicate subcellular localization of silver‐enhanced immunogold labeling of AQP4 or ATP β1 along the BBB. A: astrocyte end‐feet; B: basal lamina; E: endothelial cell; L: lumen. Scale bar = 1 μm. (b) Representative Western immunoblots for NDRG2, AQP4, ATP β1, and tubulin using protein extracts from the cortices of the sham groups or penumbra zones of the MCAO groups of Ndrg2 GFAP cKO mice or control mice. (c) Densitometric quantification of NDRG2, AQP4 and ATP β1 protein expression is shown normalized to tubulin. Data are expressed as the mean ± SEM (n = 4). **p < .01 versus sham mice, ## p < .01 versus control mice. (d) Quantification of brain water content in cortices isolated from Na+‐K+‐ATPase β1‐restored Ndrg2 GFAP cKO mice (CreV‐N2‐β1), Ndrg2 GFAP cKO mice (CreV‐N2‐ConV) and control mice (ConV) in the sham and MCAO groups. Data are shown as the mean ± SD (n = 5–6). *p < .05, **p < .01 versus sham mice, ## p < .01 versus control mice, ∆∆ p < .01 versus Ndrg2 GFAP cKO mice. (e) Representative transmission electron micrographs showing the swollen perivascular astrocytic end‐feet area (blue area). A: astrocyte end‐feet; B: basal lamina; E: endothelial cell; L: lumen. Scale bar = 2 μm. (f) Astrocyte end‐feet area‐to‐capillary lumen perimeter ratio. Data are shown as the mean ± SD (n = 5–6). *p < .05, **p < .01 versus sham mice, ## p < .01 versus control mice, ∆∆ p < .01 versus Ndrg2 GFAP cKO mice. (g) Representative images of coronal sections from mice that underwent MCAO after injection of Evans blue dye; fluorescence‐positive areas in Na+‐K+‐ATPase β1‐restored Ndrg2 GFAP cKO mice (bottom), Ndrg2 GFAP cKO mice (middle), and control mice (top) observed by microscopy. Scale bar = 500 μm. (h) Percentage of the area on the contralateral side positive for Evans blue staining. Data are shown as the mean ± SD (n = 8). ## p < .01 versus control mice, ∆∆ p < .01 versus Ndrg2 GFAP cKO mice. (i) The 10‐kDa molecular weight tracer was confined to blood vessels in sham mice, whereas it leaked out of the vessels (white arrowheads) in the penumbra of mice that underwent MCAO. Green, CD31; red, tracer. Scale bar = 10 μm. (j) Quantification of tracer fluorescence density (INT/mm2). **p < .01 versus sham mice, ∆∆ p < .01 versus Ndrg2 GFAP cKO mice [Color figure can be viewed at wileyonlinelibrary.com]
