
Fig. 8.
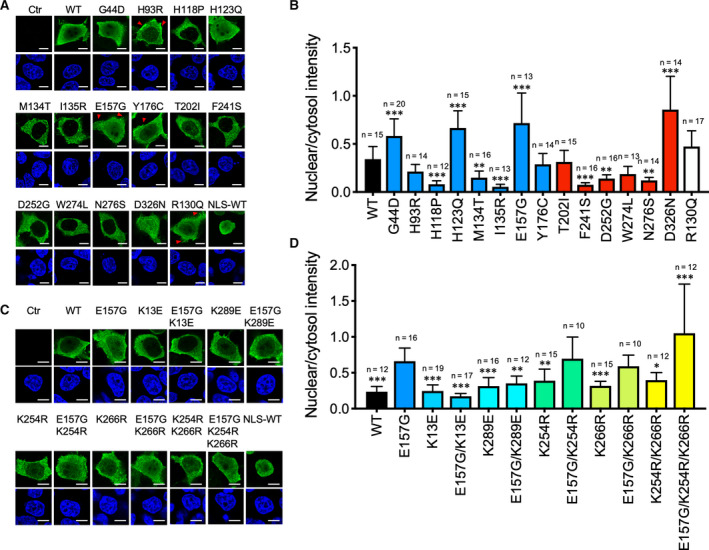
Nuclear localization of ASD‐associated PTEN mutants. (A) Immunofluorescence analysis of AU5‐tagged ASD‐associated PTEN mutants using an anti‐AU5 antibody and detected with an anti‐mouse IgG antibody conjugated with the Alexa 488 fluorophore. Cell nuclei were stained with DAPI. Positive control for nuclear staining was provided by a PTEN tagged with a NLS‐WT. Fluorescent signals were captured by confocal microscopy, and representative images are shown. Scale bars, 10 μm. (B) Fluorescent intensity was quantified for the cytosolic and nuclear compartments by the imagej software and expressed as the corresponding ratio. Results were analyzed by one‐way ANOVA with Dunnett's post‐tests, and the significance of the data is relative to the WT. The number of cells analyzed (n=) is shown. Data from a single experiment, which has been repeated once. Bars, SD. *P < 0.05; **P < 0.01; ***P < 0.001. (C) Similar experiments were carried out with E157G mutants with ubiquitination or sumoylation sites substituted. Representative images are shown. Scale bars, 10 μm. (D) Fluorescent intensity was quantified for the cytosolic and nuclear compartments and expressed as the corresponding ratio. The results were analyzed by one‐way ANOVA with Dunnett's post‐tests, and the significance of the data is relative to E157G. The number of cells analyzed (n=) is shown. Data from a single experiment, which has been repeated once. Bars, SD. *P < 0.05; **P < 0.01; ***P < 0.001.