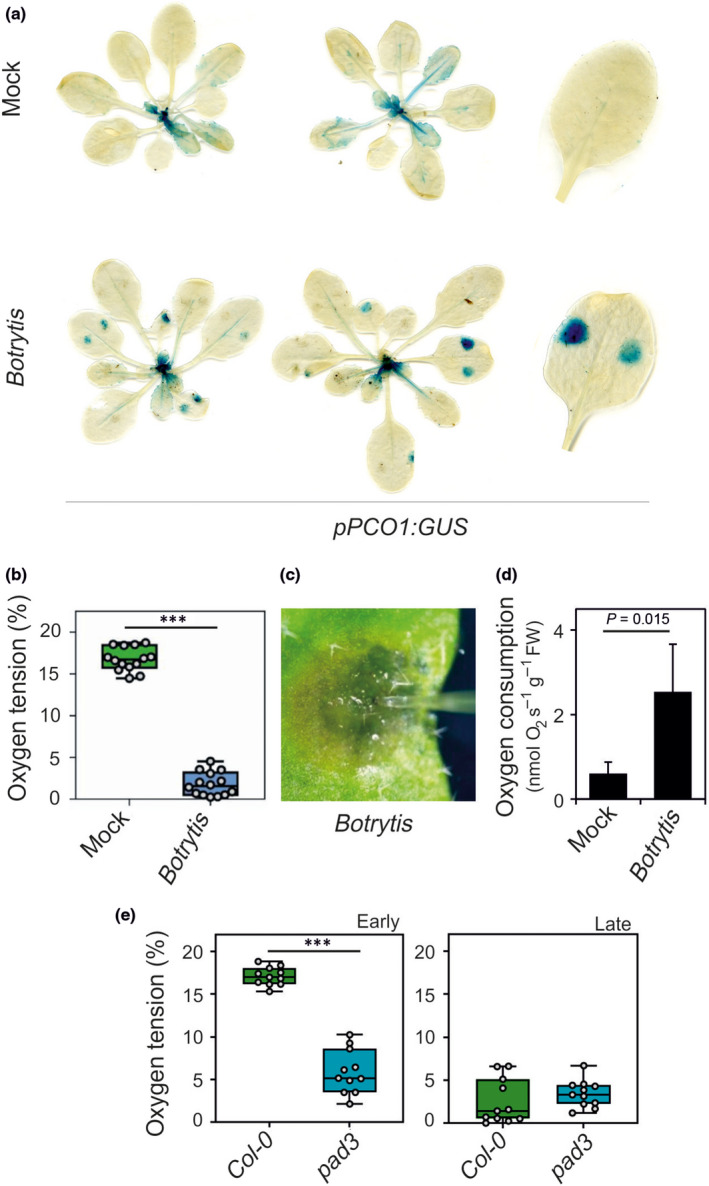
Fig. 2.

Infection by Botrytis cinerea results in localized hypoxia and expression of the transgenic line having the β‐glucuronidase (GUS) gene under the control of the PLANT CYSTEINE OXIDASE 1 (PCO1) promoter (pPCO1:GUS) reporter. Botrytis cinerea was inoculated as two drops on each leaves of Arabidopsis plants grown in soil (mock: culture broth). (a) GUS staining revealing the expression of the pPCO1:GUS reporter. (b) Oxygen tension measured using an oxygen microsensor probe (24 h post‐infection). To assess the statistical significance of the observed datasets (n = 14), one‐way ANOVA was performed followed by Tukey’s post‐hoc test (***, P < 0.001). Lines in the boxes indicate the median, the bottom and top of each box denotes the first and third quartile, respectively, the dots represent the single data points and whiskers denote the min/max values. (c) Image showing the probe inserted in the centre of the infected area. (d) Oxygen consumption rate of infected leaves compared to mock‐treated leaves (culture broth). Data are mean ± SD (n = 5). The P‐value resulting for pairwise comparison by Student’s t‐test is shown. (e) Oxygen tension measured using an oxygen microsensor probe in wild‐type plants and in pad3 plants. Data were collected at an early and late stage of infection, visually evaluated from the lesion sizes and appearance. Lines in the boxes indicate the median, the bottom and top of each box denotes the first and third quartile, respectively, the dots represent the single data points and whiskers denote the min/max values. To assess the statistical significance of the observed datasets (n = 11), one‐way ANOVA was performed followed by Tukey’s post‐hoc test (***, P < 0.001).
