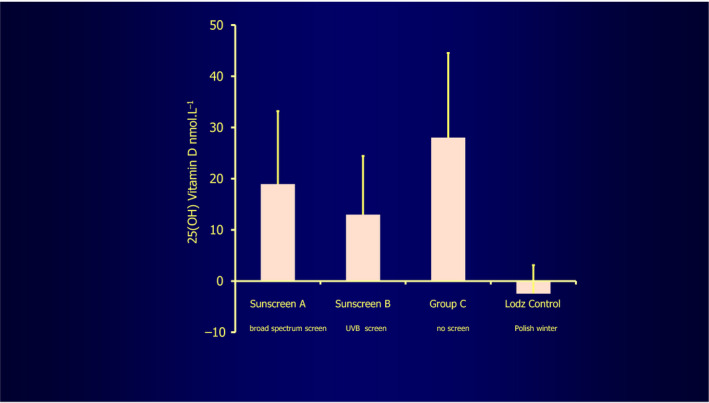
FIGURE 5.

This shows the effect of very carefully applied (under supervision) sunscreens of high sun protection factor 15, A against UVB and UVA, B just against UVB, compared with C, no sunscreen protection. The sunscreens only mildly reduce vitamin D production, sunscreen A less so. The Łódź control plot refers to control volunteers remaining in the Łódź Polish winter 19 , figure by kind courtesy of Professor Antony Young
