
Figure 2.
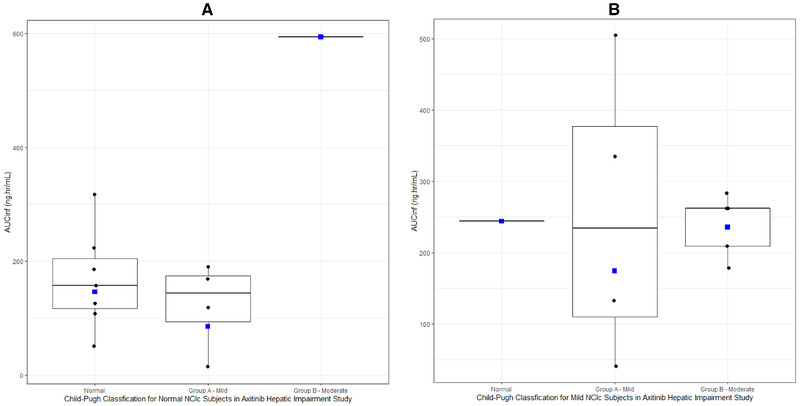
(A) Box plot of axitinib AUCinf in normal NCIc subjects by Child‐Pugh classification. Box plot provides median and 25% and 75% quartiles with whiskers to the last point within 1.5 × the interquartile range. Geometric mean is shown as blue squares. After recategorization using Child‐Pugh classification, 1 subject was classified as moderate (n = 1). (B) Box plot of axitinib AUCinf in mild NCIc subjects by Child‐Pugh classification. Box plot provides median and 25% and 75% quartiles with whiskers to the last point within 1.5 × the interquartile range. Geometric mean is shown as blue squares. After recategorization using Child‐Pugh classification, 1 subject was classified as normal (n = 1).