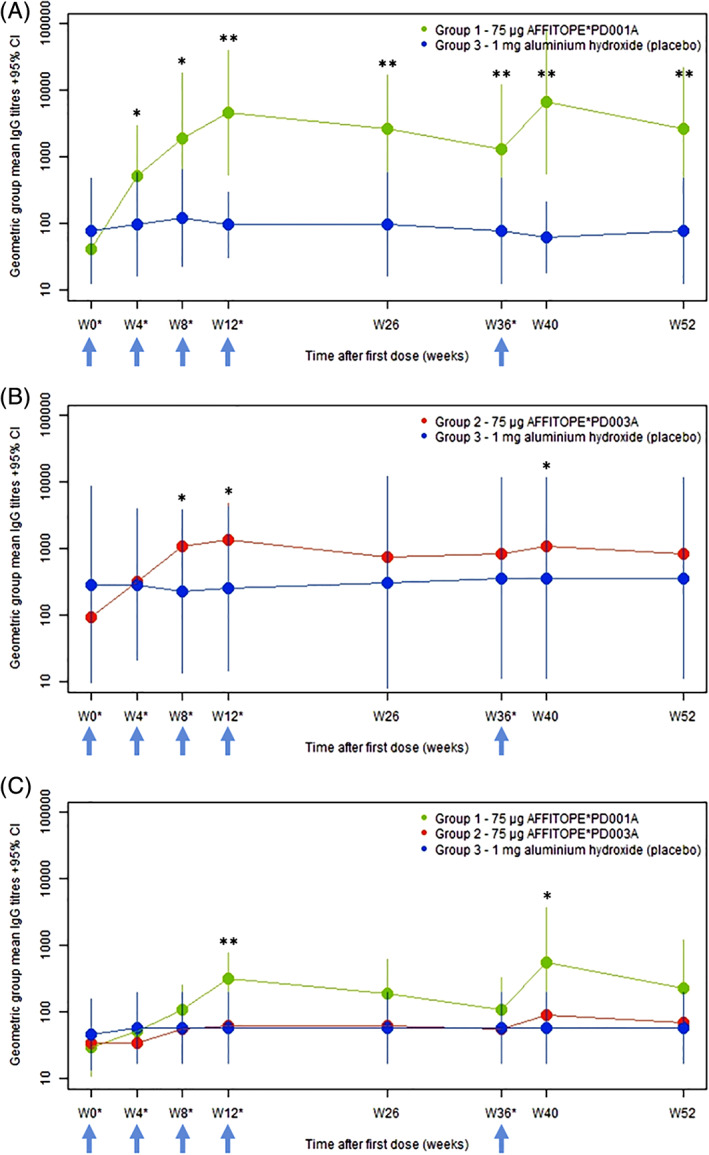
FIG. 2.

PD01, PD03, and α‐synuclein target epitope‐specific titers over time. Primary immune response to the immunizing peptides PD01 (A), PD03 (B), and the α‐synuclein target epitope (C). Bars represent the 95% confidence intervals. Arrows indicate times of injection. *P < 0.05 compared with placebo (change from baseline); **P < 0.01 compared with placebo (change from baseline). [Color figure can be viewed at wileyonlinelibrary.com]
