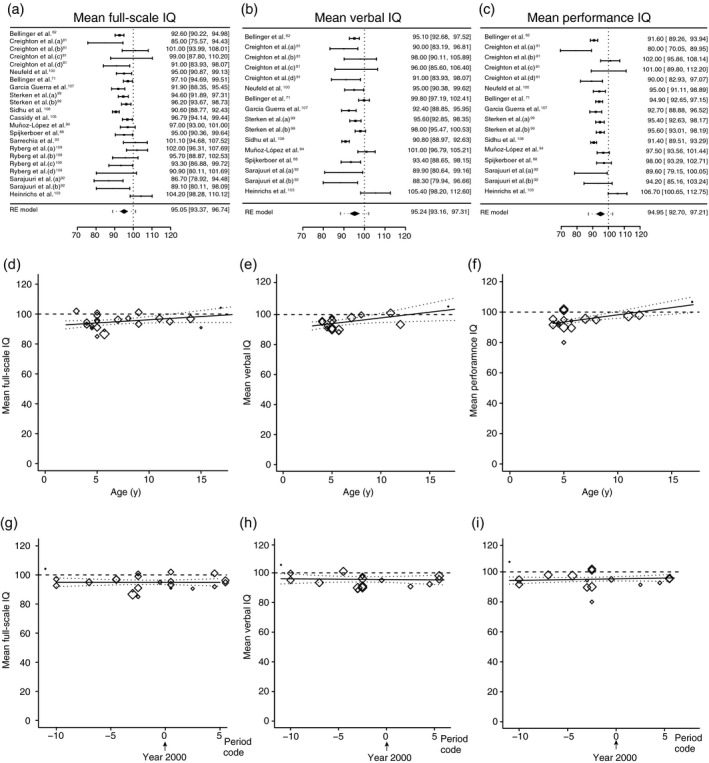
Figure 2.

Meta‐analyses of IQ scores. (a–c) Forest plots of full‐scale IQ, verbal IQ, and performance IQ respectively. The studies are listed by the author’s last name and year, and ranked according to methodological quality (high at the top). The black boxes indicate the means, the lines the confidence intervals, and the dotted lines the prediction intervals. The black diamond indicates the estimated means from the random‐effects (RE) meta‐analysis. Heterogeneity remained: (full‐scale IQ: τ 2=9.21 [p<0.001], I 2=70.3%; verbal IQ: τ 2 =11.2 [p<0.001], I 2=75.7%; performance IQ: τ 2=14.1 [p<0.001], I 2 =80.4%). (d–f) Bubble plot regression graphs of the association between assessment age of the child and full‐scale IQ, verbal IQ, and performance IQ respectively. (g–i) Bubble plot regression graphs of the association between surgery era and full‐scale IQ, verbal IQ, and performance IQ respectively. For explanation, see the description of Figure 1.
